29
/
en
AIzaSyAYiBZKx7MnpbEhh9jyipgxe19OcubqV5w
April 1, 2024
51143
Middle income
MIC
false
2
1
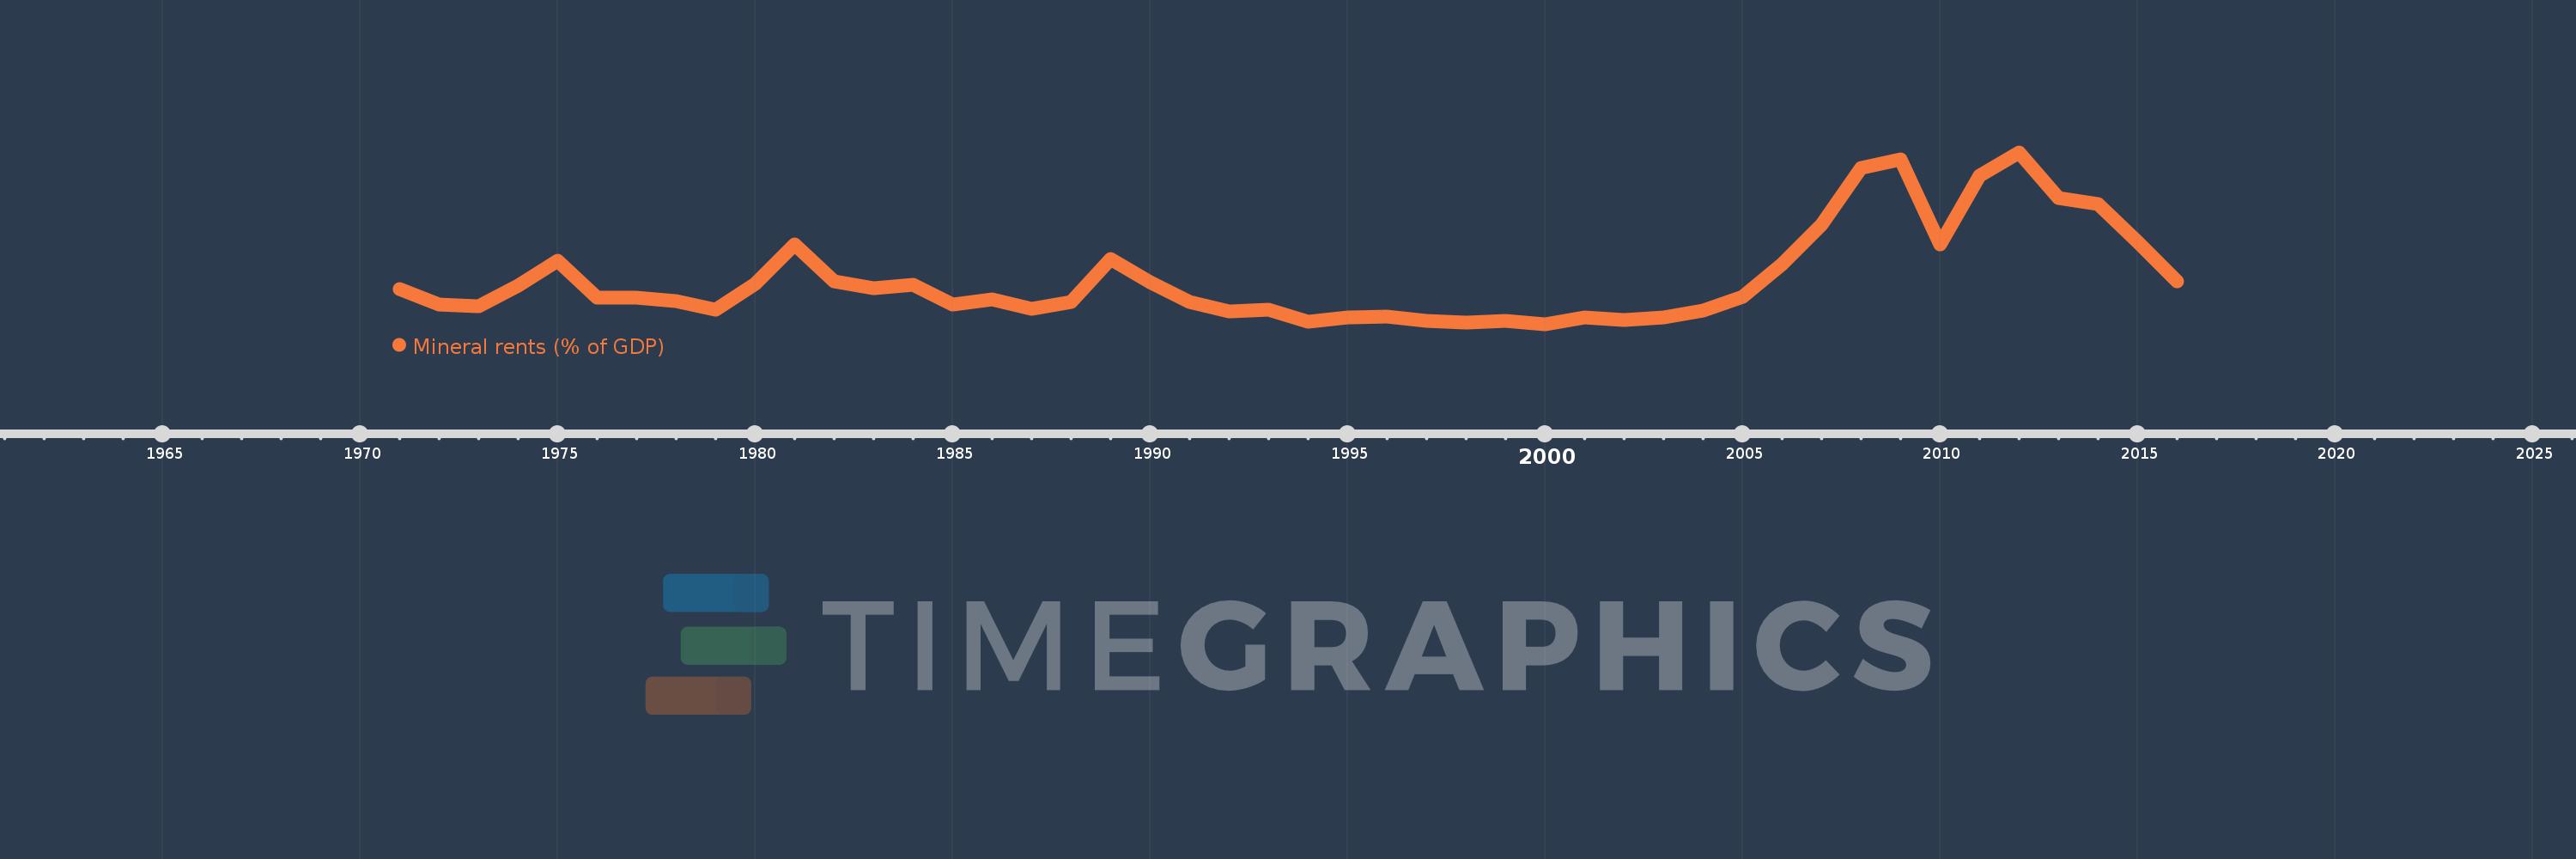
Mineral rents (% of GDP)
2016,2015,2014,2013,2012,2011,2010,2009,2008,2007,2006,2005,2004,2003,2002,2001,2000,1999,1998,1997,1996,1995,1994,1993,1992,1991,1990,1989,1988,1987,1986,1985,1984,1983,1982,1981,1980,1979,1978,1977,1976,1975,1974,1973,1972,1971
This statistics in other country:
AfghanistanAlbaniaAlgeriaAndorraAngolaAntigua and BarbudaArab WorldArgentinaArmeniaArubaAustraliaAustriaAzerbaijanBahamas, TheBahrainBangladeshBarbadosBelarusBelgiumBelizeBeninBermudaBhutanBoliviaBosnia and HerzegovinaBotswanaBrazilBrunei DarussalamBulgariaBurkina FasoBurundiCabo VerdeCambodiaCameroonCanadaCaribbean small statesCayman IslandsCentral African RepublicCentral Europe and the BalticsChadChannel IslandsChileChinaColombiaComorosCongo, Dem. Rep.Congo, Rep.Costa RicaCote d'IvoireCroatiaCubaCyprusCzech RepublicDenmarkDjiboutiDominicaDominican RepublicEarly-demographic dividendEast Asia & PacificEast Asia & Pacific (excluding high income)East Asia & Pacific (IDA & IBRD countries)EcuadorEgypt, Arab Rep.El SalvadorEquatorial GuineaEritreaEstoniaEthiopiaEuro areaEurope & Central AsiaEurope & Central Asia (excluding high income)Europe & Central Asia (IDA & IBRD countries)European UnionFaroe IslandsFijiFinlandFragile and conflict affected situationsFranceFrench PolynesiaGabonGambia, TheGeorgiaGermanyGhanaGreeceGreenlandGrenadaGuatemalaGuineaGuinea-BissauGuyanaHaitiHeavily indebted poor countries (HIPC)High incomeHondurasHong Kong SAR, ChinaHungaryIBRD onlyIcelandIDA & IBRD totalIDA blendIDA onlyIDA totalIndiaIndonesiaIran, Islamic Rep.IraqIrelandIsle of ManIsraelItalyJamaicaJapanJordanKazakhstanKenyaKiribatiKorea, Rep.KosovoKuwaitKyrgyz RepublicLao PDRLate-demographic dividendLatin America & Caribbean Latin America & Caribbean (excluding high income)Latin America & the Caribbean (IDA & IBRD countries)LatviaLeast developed countries: UN classificationLebanonLesothoLiberiaLibyaLiechtensteinLithuaniaLow & middle incomeLow incomeLower middle incomeLuxembourgMacao SAR, ChinaMacedonia, FYRMadagascarMalawiMalaysiaMaldivesMaliMaltaMarshall IslandsMauritaniaMauritiusMexicoMicronesia, Fed. Sts.Middle East & North AfricaMiddle East & North Africa (excluding high income)Middle East & North Africa (IDA & IBRD countries)Middle incomeMoldovaMonacoMongoliaMontenegroMoroccoMozambiqueMyanmarNamibiaNepalNetherlandsNew CaledoniaNew ZealandNicaraguaNigerNigeriaNorth AmericaNorwayOECD membersOmanOther small statesPacific island small statesPakistanPalauPanamaPapua New GuineaParaguayPeruPhilippinesPolandPortugalPost-demographic dividendPre-demographic dividendPuerto RicoQatarRomaniaRussian FederationRwandaSamoaSan MarinoSao Tome and PrincipeSaudi ArabiaSenegalSerbiaSeychellesSierra LeoneSingaporeSlovak RepublicSloveniaSmall statesSolomon IslandsSomaliaSouth AfricaSouth AsiaSouth Asia (IDA & IBRD)South SudanSpainSri LankaSt. Kitts and NevisSt. LuciaSt. Vincent and the GrenadinesSub-Saharan Africa Sub-Saharan Africa (excluding high income)Sub-Saharan Africa (IDA & IBRD countries)SudanSurinameSwazilandSwedenSwitzerlandSyrian Arab RepublicTajikistanTanzaniaThailandTimor-LesteTogoTongaTrinidad and TobagoTunisiaTurkeyTurkmenistanTuvaluUgandaUkraineUnited Arab EmiratesUnited KingdomUnited StatesUpper middle incomeUruguayUzbekistanVanuatuVenezuela, RBVietnamVirgin Islands (U.S.)West Bank and GazaWorldYemen, Rep.ZambiaZimbabwe Timeline:
This timeline shows a graph from 1971 to 2016 of Middle income. No data until 1970. Number of actual observations by date: 46.
Source name:
World Development Indicators
Source organization:
Estimates based on sources and methods described in "The Changing Wealth of Nations: Measuring Sustainable Development in the New Millennium" (World Bank, 2011).
Categories, topics:
Energy & Mining, Environment
Last updated:
apr 23, 2017
Indicators value changes by year
At the date of observation
Value
Absolute change
Change from previous value
jan 1, 1971
0.577
+0.577
0.0%
jan 1, 1972
0.404
-0.173
-29.96%
jan 1, 1973
0.388
-0.016
-4.07%
jan 1, 1974
0.611
+0.223
57.57%
jan 1, 1975
0.891
+0.28
45.78%
jan 1, 1976
0.483
-0.408
-45.81%
jan 1, 1977
0.48
-0.003
-0.61%
jan 1, 1978
0.441
-0.039
-8.04%
jan 1, 1979
0.349
-0.092
-20.92%
jan 1, 1980
0.629
+0.279
80.07%
jan 1, 1981
1.069
+0.44
70.02%
jan 1, 1982
0.664
-0.404
-37.85%
jan 1, 1983
0.584
-0.08
-12.07%
jan 1, 1984
0.626
+0.042
7.27%
jan 1, 1985
0.405
-0.221
-35.28%
jan 1, 1986
0.46
+0.055
13.47%
jan 1, 1987
0.36
-0.1
-21.67%
jan 1, 1988
0.439
+0.079
21.8%
jan 1, 1989
0.905
+0.466
106.08%
jan 1, 1990
0.648
-0.256
-28.32%
jan 1, 1991
0.431
-0.218
-33.56%
jan 1, 1992
0.333
-0.097
-22.59%
jan 1, 1993
0.345
+0.011
3.38%
jan 1, 1994
0.218
-0.127
-36.74%
jan 1, 1995
0.263
+0.045
20.68%
jan 1, 1996
0.276
+0.013
5.0%
jan 1, 1997
0.228
-0.048
-17.33%
jan 1, 1998
0.21
-0.018
-8.03%
jan 1, 1999
0.226
+0.016
7.54%
jan 1, 2000
0.189
-0.037
-16.31%
jan 1, 2001
0.265
+0.076
40.08%
jan 1, 2002
0.234
-0.031
-11.68%
jan 1, 2003
0.266
+0.032
13.58%
jan 1, 2004
0.336
+0.07
26.25%
jan 1, 2005
0.488
+0.153
45.49%
jan 1, 2006
0.854
+0.365
74.88%
jan 1, 2007
1.287
+0.434
50.8%
jan 1, 2008
1.912
+0.625
48.53%
jan 1, 2009
2.009
+0.097
5.1%
jan 1, 2010
1.07
-0.939
-46.73%
jan 1, 2011
1.831
+0.761
71.07%
jan 1, 2012
2.084
+0.253
13.79%
jan 1, 2013
1.577
-0.506
-24.3%
jan 1, 2014
1.51
-0.068
-4.28%
jan 1, 2015
1.093
-0.417
-27.62%
jan 1, 2016
0.659
-0.434
-39.7%
Ranking of countries by current statistics by years


Comments: