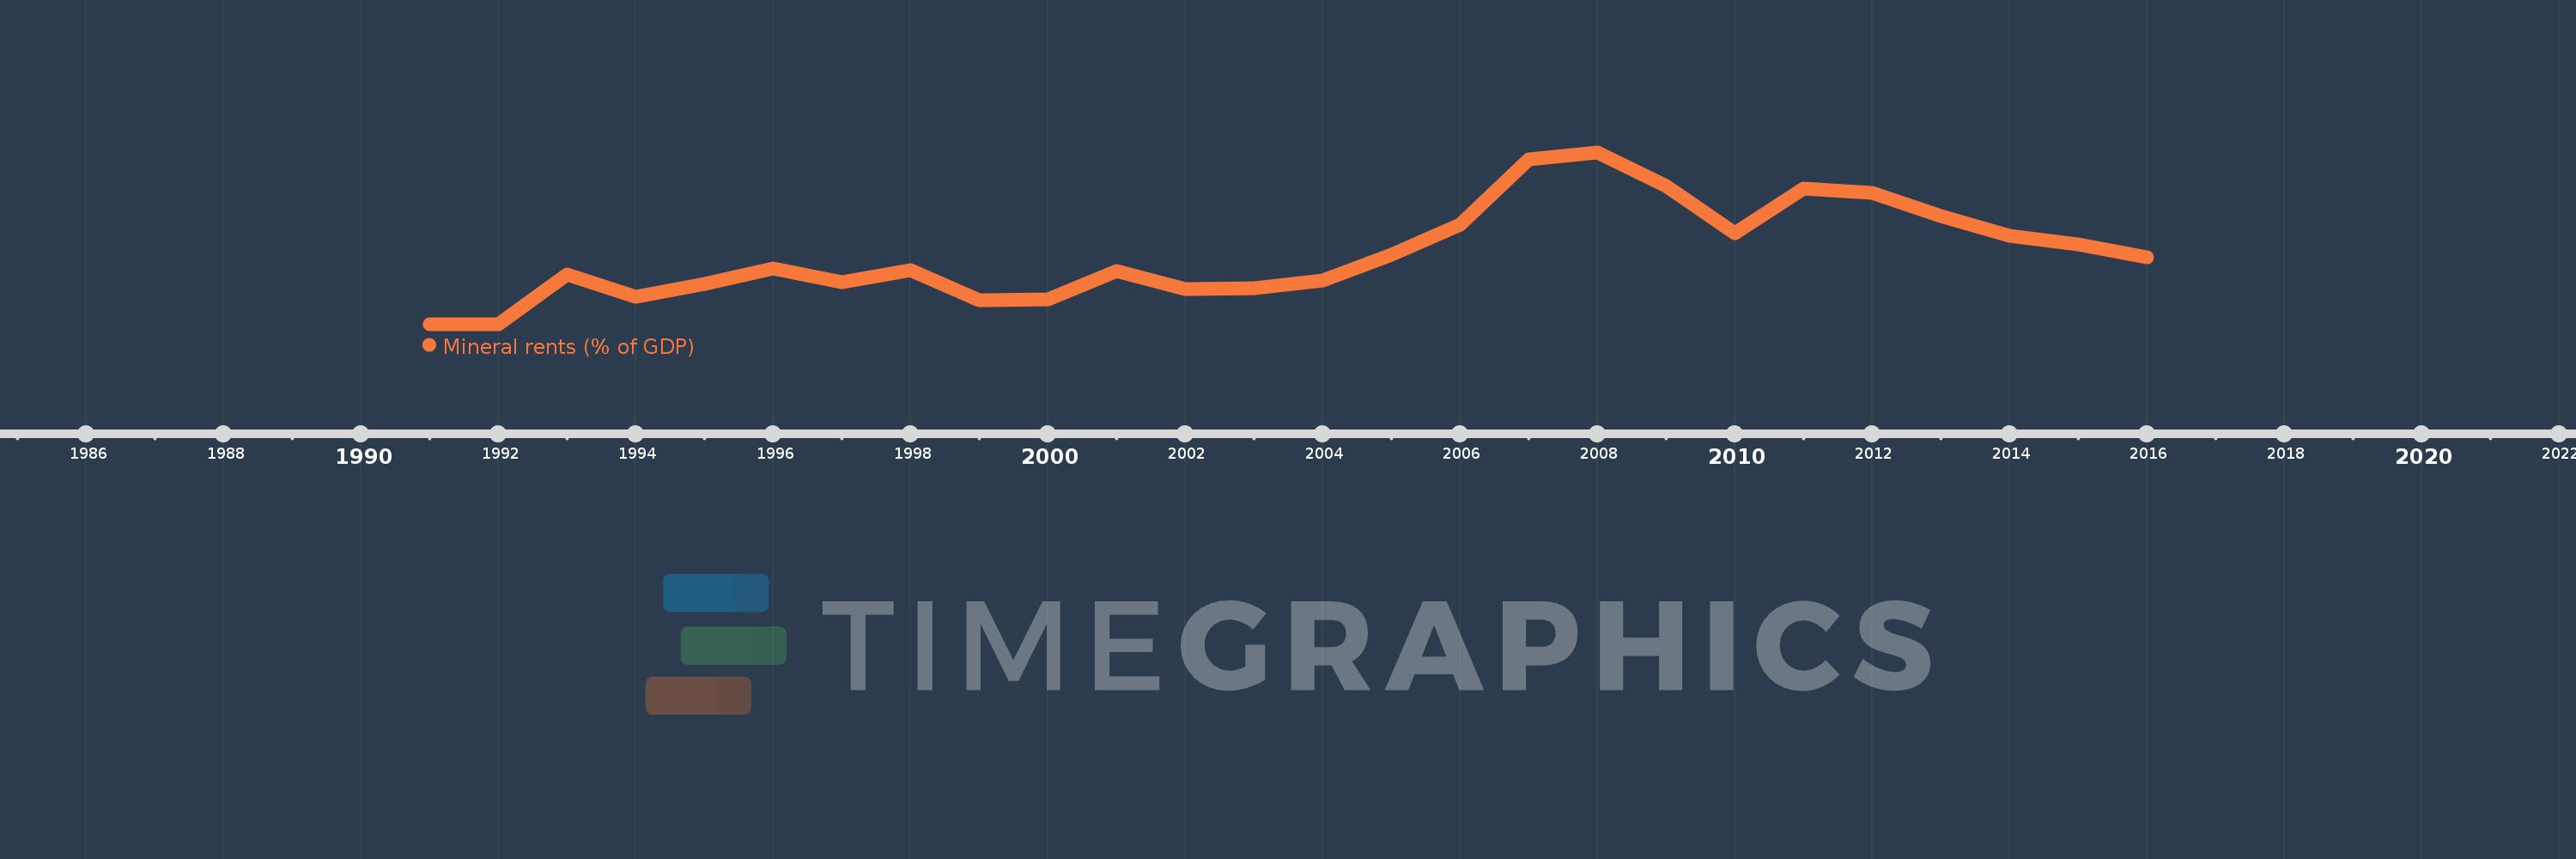
This timeline shows a graph from 1991 to 2016 of Kazakhstan. No data until 1990. Number of actual observations by date: 26.
Source name:
World Development Indicators
Source organization:
Estimates based on sources and methods described in "The Changing Wealth of Nations: Measuring Sustainable Development in the New Millennium" (World Bank, 2011).
Categories, topics:
Energy & Mining, Environment
Last updated:
apr 23, 2017
Indicators value changes by year
Meaning:
2.319
Minimum:
0.0
jan 1, 1991
Maximum:
5.657
jan 1, 2008
At the date of observation
Value
Absolute change
Change from the previous value
jan 1, 1991
0.0
0.0
0.0%
jan 1, 1992
0.0
0.0
%
jan 1, 1993
1.641
+1.641
%
jan 1, 1994
0.909
-0.732
-44.59%
jan 1, 1995
1.335
+0.426
46.88%
jan 1, 1996
1.823
+0.488
36.56%
jan 1, 1997
1.38
-0.443
-24.29%
jan 1, 1998
1.774
+0.393
28.48%
jan 1, 1999
0.779
-0.994
-56.06%
jan 1, 2000
0.824
+0.045
5.74%
jan 1, 2001
1.756
+0.932
113.08%
jan 1, 2002
1.143
-0.613
-34.89%
jan 1, 2003
1.177
+0.034
2.93%
jan 1, 2004
1.449
+0.272
23.12%
jan 1, 2005
2.284
+0.835
57.61%
jan 1, 2006
3.27
+0.986
43.19%
jan 1, 2007
5.432
+2.163
66.14%
jan 1, 2008
5.657
+0.225
4.14%
jan 1, 2009
4.545
-1.112
-19.66%
jan 1, 2010
2.994
-1.551
-34.12%
jan 1, 2011
4.477
+1.483
49.51%
jan 1, 2012
4.331
-0.146
-3.25%
jan 1, 2013
3.557
-0.774
-17.87%
jan 1, 2014
2.918
-0.639
-17.96%
jan 1, 2015
2.62
-0.299
-10.23%
jan 1, 2016
2.213
-0.407
-15.54%
Ranking of countries by current statistics by years
