29
/
en
AIzaSyAYiBZKx7MnpbEhh9jyipgxe19OcubqV5w
April 1, 2024
56420
Small states
SST
false
2
1
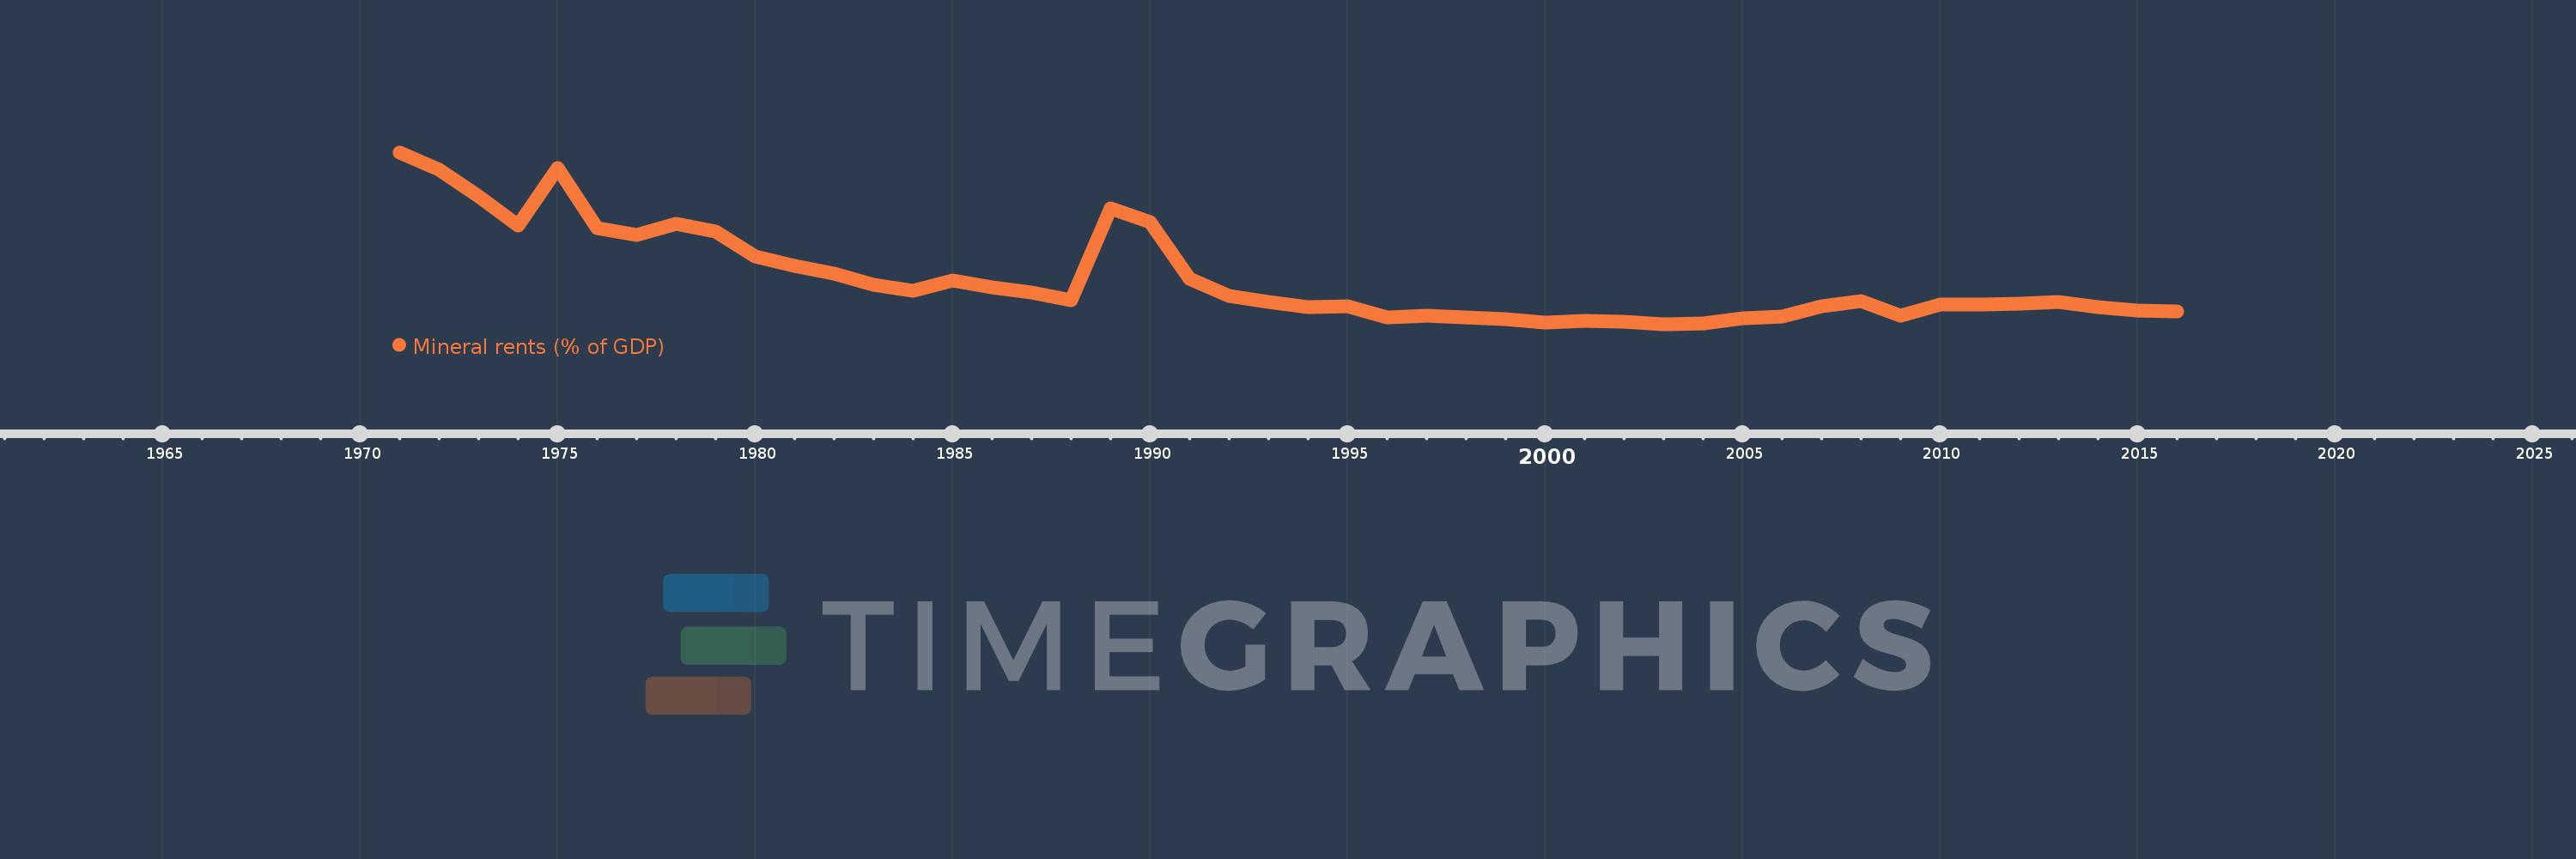
Mineral rents (% of GDP)
2016,2015,2014,2013,2012,2011,2010,2009,2008,2007,2006,2005,2004,2003,2002,2001,2000,1999,1998,1997,1996,1995,1994,1993,1992,1991,1990,1989,1988,1987,1986,1985,1984,1983,1982,1981,1980,1979,1978,1977,1976,1975,1974,1973,1972,1971
This statistics in other country:
AfghanistanAlbaniaAlgeriaAndorraAngolaAntigua and BarbudaArab WorldArgentinaArmeniaArubaAustraliaAustriaAzerbaijanBahamas, TheBahrainBangladeshBarbadosBelarusBelgiumBelizeBeninBermudaBhutanBoliviaBosnia and HerzegovinaBotswanaBrazilBrunei DarussalamBulgariaBurkina FasoBurundiCabo VerdeCambodiaCameroonCanadaCaribbean small statesCayman IslandsCentral African RepublicCentral Europe and the BalticsChadChannel IslandsChileChinaColombiaComorosCongo, Dem. Rep.Congo, Rep.Costa RicaCote d'IvoireCroatiaCubaCyprusCzech RepublicDenmarkDjiboutiDominicaDominican RepublicEarly-demographic dividendEast Asia & PacificEast Asia & Pacific (excluding high income)East Asia & Pacific (IDA & IBRD countries)EcuadorEgypt, Arab Rep.El SalvadorEquatorial GuineaEritreaEstoniaEthiopiaEuro areaEurope & Central AsiaEurope & Central Asia (excluding high income)Europe & Central Asia (IDA & IBRD countries)European UnionFaroe IslandsFijiFinlandFragile and conflict affected situationsFranceFrench PolynesiaGabonGambia, TheGeorgiaGermanyGhanaGreeceGreenlandGrenadaGuatemalaGuineaGuinea-BissauGuyanaHaitiHeavily indebted poor countries (HIPC)High incomeHondurasHong Kong SAR, ChinaHungaryIBRD onlyIcelandIDA & IBRD totalIDA blendIDA onlyIDA totalIndiaIndonesiaIran, Islamic Rep.IraqIrelandIsle of ManIsraelItalyJamaicaJapanJordanKazakhstanKenyaKiribatiKorea, Rep.KosovoKuwaitKyrgyz RepublicLao PDRLate-demographic dividendLatin America & Caribbean Latin America & Caribbean (excluding high income)Latin America & the Caribbean (IDA & IBRD countries)LatviaLeast developed countries: UN classificationLebanonLesothoLiberiaLibyaLiechtensteinLithuaniaLow & middle incomeLow incomeLower middle incomeLuxembourgMacao SAR, ChinaMacedonia, FYRMadagascarMalawiMalaysiaMaldivesMaliMaltaMarshall IslandsMauritaniaMauritiusMexicoMicronesia, Fed. Sts.Middle East & North AfricaMiddle East & North Africa (excluding high income)Middle East & North Africa (IDA & IBRD countries)Middle incomeMoldovaMonacoMongoliaMontenegroMoroccoMozambiqueMyanmarNamibiaNepalNetherlandsNew CaledoniaNew ZealandNicaraguaNigerNigeriaNorth AmericaNorwayOECD membersOmanOther small statesPacific island small statesPakistanPalauPanamaPapua New GuineaParaguayPeruPhilippinesPolandPortugalPost-demographic dividendPre-demographic dividendPuerto RicoQatarRomaniaRussian FederationRwandaSamoaSan MarinoSao Tome and PrincipeSaudi ArabiaSenegalSerbiaSeychellesSierra LeoneSingaporeSlovak RepublicSloveniaSmall statesSolomon IslandsSomaliaSouth AfricaSouth AsiaSouth Asia (IDA & IBRD)South SudanSpainSri LankaSt. Kitts and NevisSt. LuciaSt. Vincent and the GrenadinesSub-Saharan Africa Sub-Saharan Africa (excluding high income)Sub-Saharan Africa (IDA & IBRD countries)SudanSurinameSwazilandSwedenSwitzerlandSyrian Arab RepublicTajikistanTanzaniaThailandTimor-LesteTogoTongaTrinidad and TobagoTunisiaTurkeyTurkmenistanTuvaluUgandaUkraineUnited Arab EmiratesUnited KingdomUnited StatesUpper middle incomeUruguayUzbekistanVanuatuVenezuela, RBVietnamVirgin Islands (U.S.)West Bank and GazaWorldYemen, Rep.ZambiaZimbabwe Timeline:
This timeline shows a graph from 1971 to 2016 of Small states. No data until 1970. Number of actual observations by date: 46.
Source name:
World Development Indicators
Source organization:
Estimates based on sources and methods described in "The Changing Wealth of Nations: Measuring Sustainable Development in the New Millennium" (World Bank, 2011).
Categories, topics:
Energy & Mining, Environment
Last updated:
apr 23, 2017
Indicators value changes by year
At the date of observation
Value
Absolute change
Change from previous value
jan 1, 1971
3.605
+3.605
0.0%
jan 1, 1972
3.256
-0.349
-9.67%
jan 1, 1973
2.728
-0.528
-16.2%
jan 1, 1974
2.143
-0.585
-21.46%
jan 1, 1975
3.289
+1.146
53.49%
jan 1, 1976
2.089
-1.201
-36.51%
jan 1, 1977
1.946
-0.143
-6.82%
jan 1, 1978
2.167
+0.221
11.38%
jan 1, 1979
2.014
-0.154
-7.1%
jan 1, 1980
1.508
-0.505
-25.09%
jan 1, 1981
1.33
-0.178
-11.81%
jan 1, 1982
1.177
-0.153
-11.52%
jan 1, 1983
0.952
-0.225
-19.15%
jan 1, 1984
0.826
-0.126
-13.24%
jan 1, 1985
1.036
+0.21
25.45%
jan 1, 1986
0.9
-0.136
-13.12%
jan 1, 1987
0.786
-0.114
-12.66%
jan 1, 1988
0.628
-0.158
-20.1%
jan 1, 1989
2.481
+1.853
295.16%
jan 1, 1990
2.209
-0.272
-10.97%
jan 1, 1991
1.059
-1.15
-52.04%
jan 1, 1992
0.719
-0.341
-32.17%
jan 1, 1993
0.604
-0.114
-15.91%
jan 1, 1994
0.498
-0.106
-17.58%
jan 1, 1995
0.52
+0.022
4.41%
jan 1, 1996
0.289
-0.231
-44.49%
jan 1, 1997
0.33
+0.041
14.2%
jan 1, 1998
0.294
-0.036
-10.94%
jan 1, 1999
0.248
-0.045
-15.47%
jan 1, 2000
0.188
-0.061
-24.4%
jan 1, 2001
0.227
+0.04
21.12%
jan 1, 2002
0.197
-0.03
-13.24%
jan 1, 2003
0.153
-0.045
-22.59%
jan 1, 2004
0.174
+0.022
14.19%
jan 1, 2005
0.274
+0.099
57.07%
jan 1, 2006
0.307
+0.034
12.25%
jan 1, 2007
0.518
+0.21
68.43%
jan 1, 2008
0.611
+0.093
18.05%
jan 1, 2009
0.322
-0.289
-47.25%
jan 1, 2010
0.552
+0.23
71.3%
jan 1, 2011
0.54
-0.012
-2.26%
jan 1, 2012
0.569
+0.029
5.39%
jan 1, 2013
0.597
+0.028
4.91%
jan 1, 2014
0.496
-0.1
-16.77%
jan 1, 2015
0.422
-0.075
-15.08%
jan 1, 2016
0.414
-0.007
-1.75%
Ranking of countries by current statistics by years


Comments: