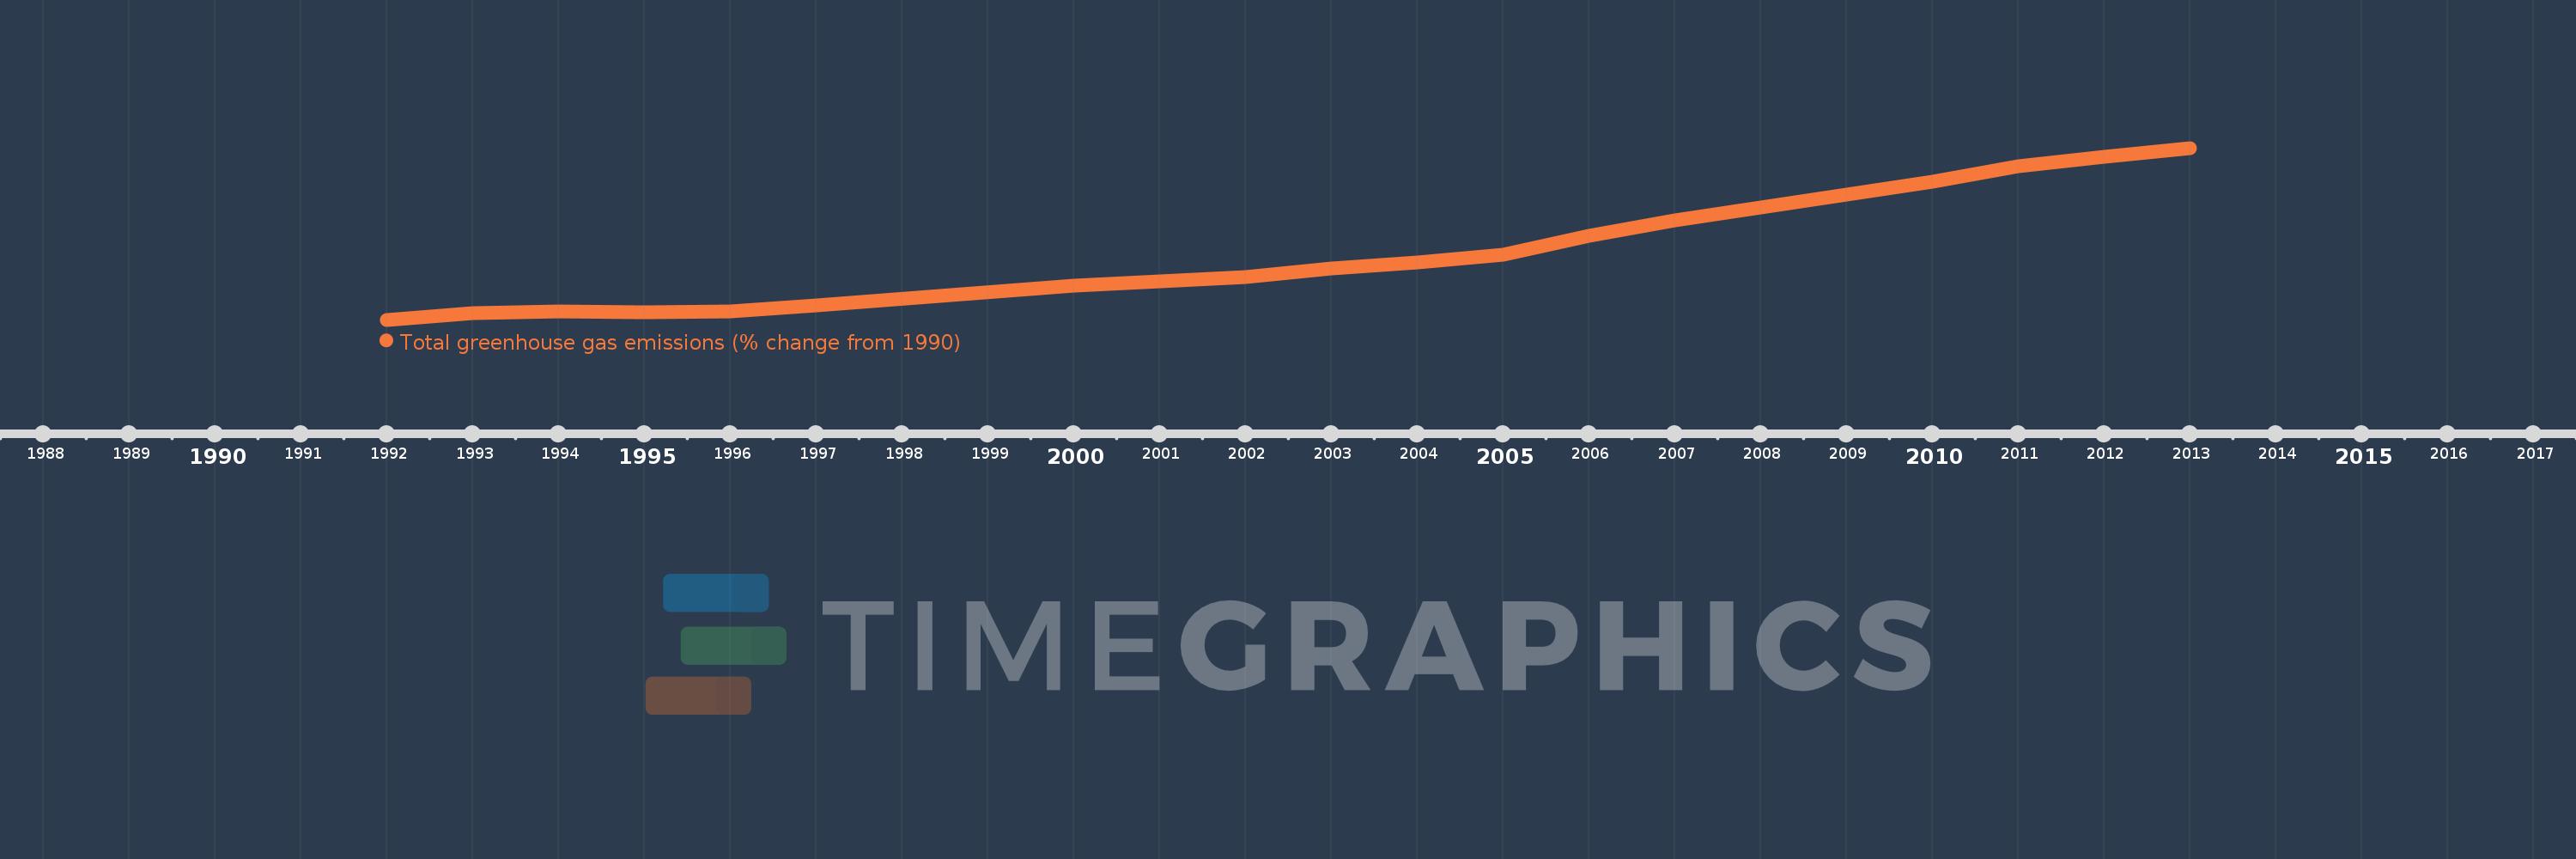
This timeline shows a graph from 1992 to 2013 of Bahrain. No data until 1991. Number of actual observations by date: 17.
Source name:
World Development Indicators
Source organization:
World Bank staff estimates from original source: European Commission, Joint Research Centre (JRC)/Netherlands Environmental Assessment Agency (PBL). Emission Database for Global Atmospheric Research (EDGAR): http://edgar.jrc.ec.europa.eu/.
Categories, topics:
Climate Change, Environment
Last updated:
apr 23, 2017
Indicators value changes by year
Meaning:
25.594
Minimum:
-15.336
jan 1, 1992
Maximum:
92.655
jan 1, 2013
At the date of observation
Value
Absolute change
Change from the previous value
jan 1, 1992
-15.336
-15.336
0.0%
jan 1, 1993
-10.959
+4.376
-28.54%
jan 1, 1994
-10.091
+0.868
-7.92%
jan 1, 1995
-10.757
-0.666
6.6%
jan 1, 1996
-10.091
+0.666
-6.19%
jan 1, 1997
-6.241
+3.85
-38.15%
jan 1, 2000
5.849
+12.09
-193.71%
jan 1, 2002
11.733
+5.884
100.61%
jan 1, 2003
17.104
+5.371
45.77%
jan 1, 2004
20.46
+3.356
19.62%
jan 1, 2005
25.808
+5.348
26.14%
jan 1, 2006
37.428
+11.62
45.02%
jan 1, 2007
47.315
+9.887
26.42%
jan 1, 2010
71.545
+24.23
51.21%
jan 1, 2011
81.353
+9.808
13.71%
jan 1, 2012
87.33
+5.977
7.35%
jan 1, 2013
92.655
+5.326
6.1%
Ranking of countries by current statistics by years
