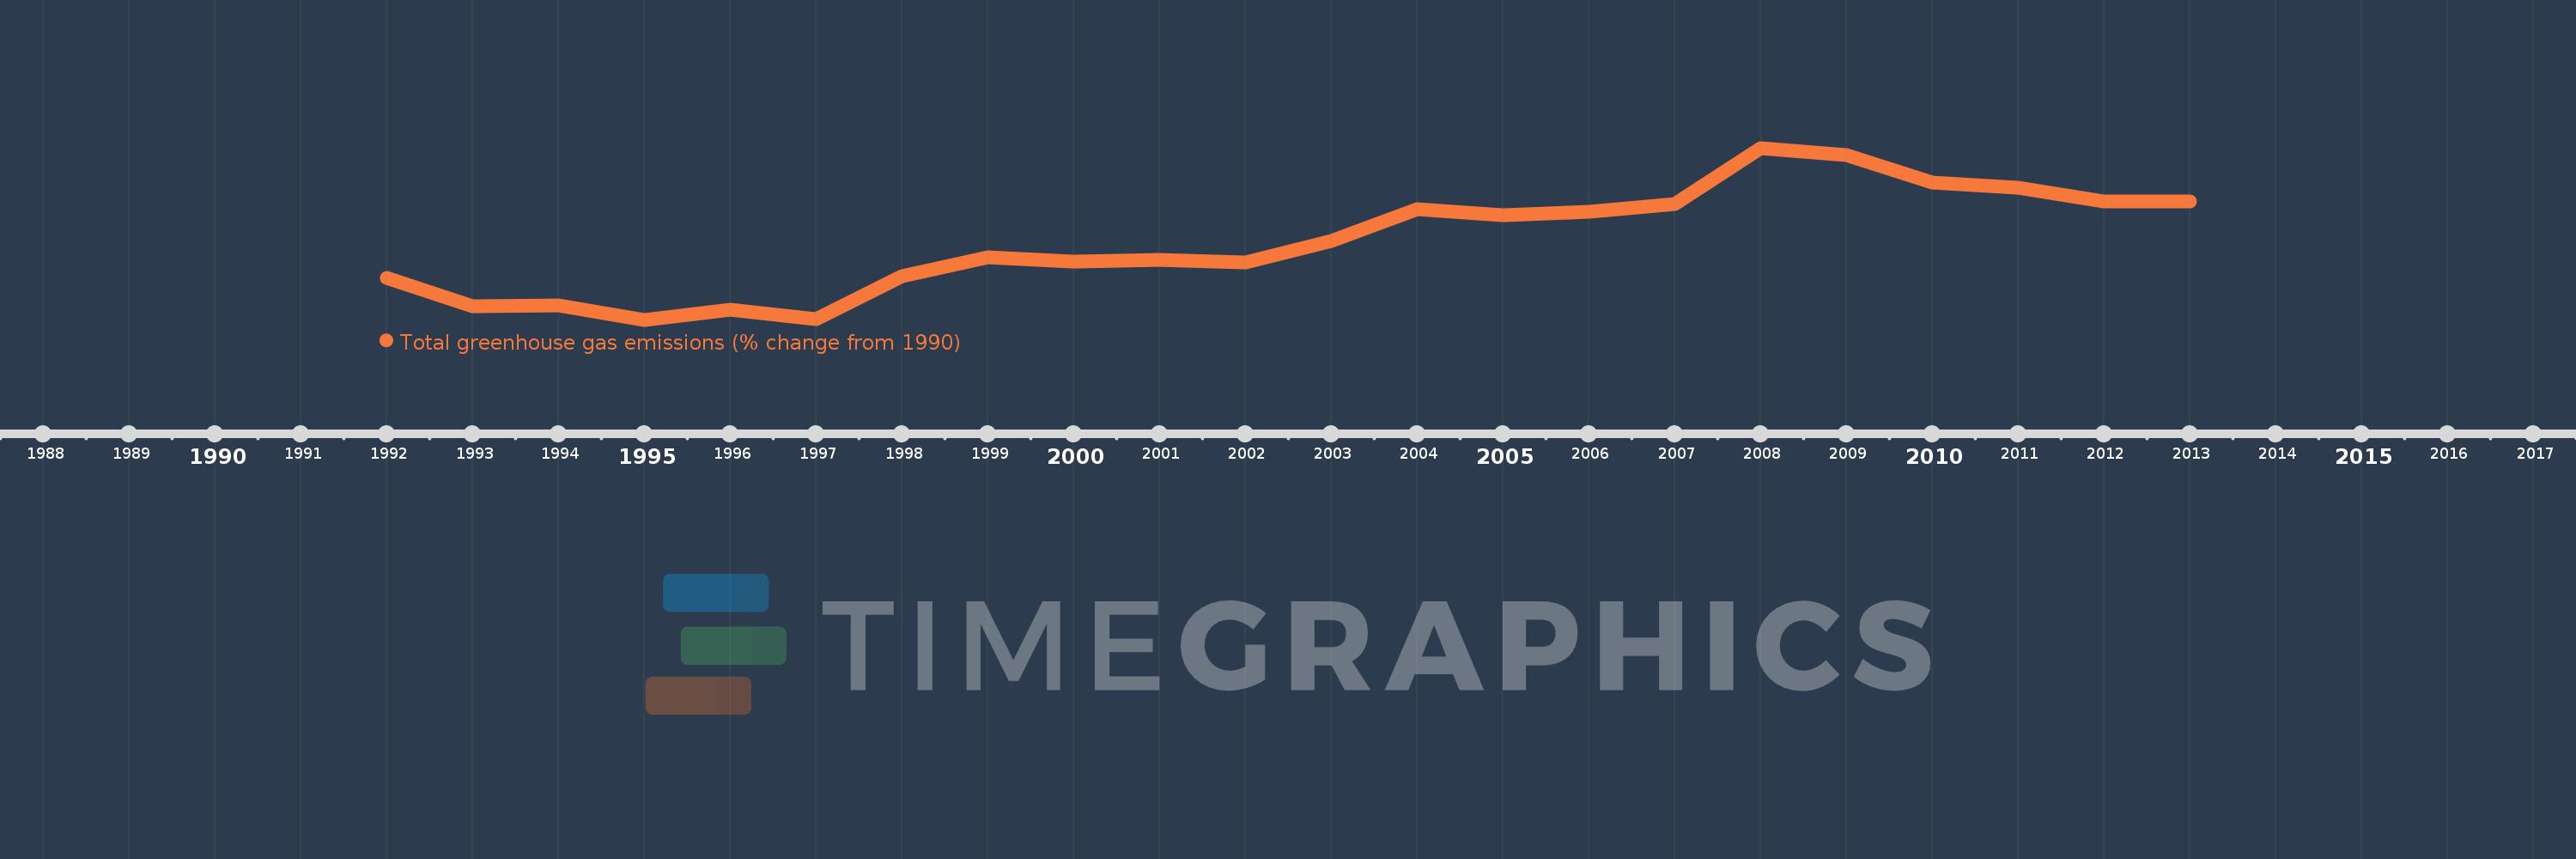
This timeline shows a graph from 1992 to 2013 of Croatia. No data until 1991. Number of actual observations by date: 22.
Source name:
World Development Indicators
Source organization:
World Bank staff estimates from original source: European Commission, Joint Research Centre (JRC)/Netherlands Environmental Assessment Agency (PBL). Emission Database for Global Atmospheric Research (EDGAR): http://edgar.jrc.ec.europa.eu/.
Categories, topics:
Climate Change, Environment
Last updated:
apr 23, 2017
Indicators value changes by year
Meaning:
-18.564
Minimum:
-30.651
jan 1, 1995
Maximum:
-4.126
jan 1, 2008
At the date of observation
Value
Absolute change
Change from the previous value
jan 1, 1992
-24.145
-24.145
0.0%
jan 1, 1993
-28.616
-4.47
18.51%
jan 1, 1994
-28.37
+0.246
-0.86%
jan 1, 1995
-30.651
-2.282
8.04%
jan 1, 1996
-29.116
+1.536
-5.01%
jan 1, 1997
-30.612
-1.497
5.14%
jan 1, 1998
-23.865
+6.747
-22.04%
jan 1, 1999
-21.023
+2.842
-11.91%
jan 1, 2000
-21.682
-0.659
3.13%
jan 1, 2001
-21.369
+0.313
-1.45%
jan 1, 2002
-21.792
-0.423
1.98%
jan 1, 2003
-18.519
+3.272
-15.02%
jan 1, 2004
-13.596
+4.924
-26.59%
jan 1, 2005
-14.518
-0.922
6.78%
jan 1, 2006
-14.023
+0.495
-3.41%
jan 1, 2007
-12.795
+1.228
-8.76%
jan 1, 2008
-4.126
+8.669
-67.75%
jan 1, 2009
-5.171
-1.045
25.33%
jan 1, 2010
-9.424
-4.252
82.23%
jan 1, 2011
-10.254
-0.83
8.81%
jan 1, 2012
-12.324
-2.07
20.19%
jan 1, 2013
-12.418
-0.093
0.76%
Ranking of countries by current statistics by years
