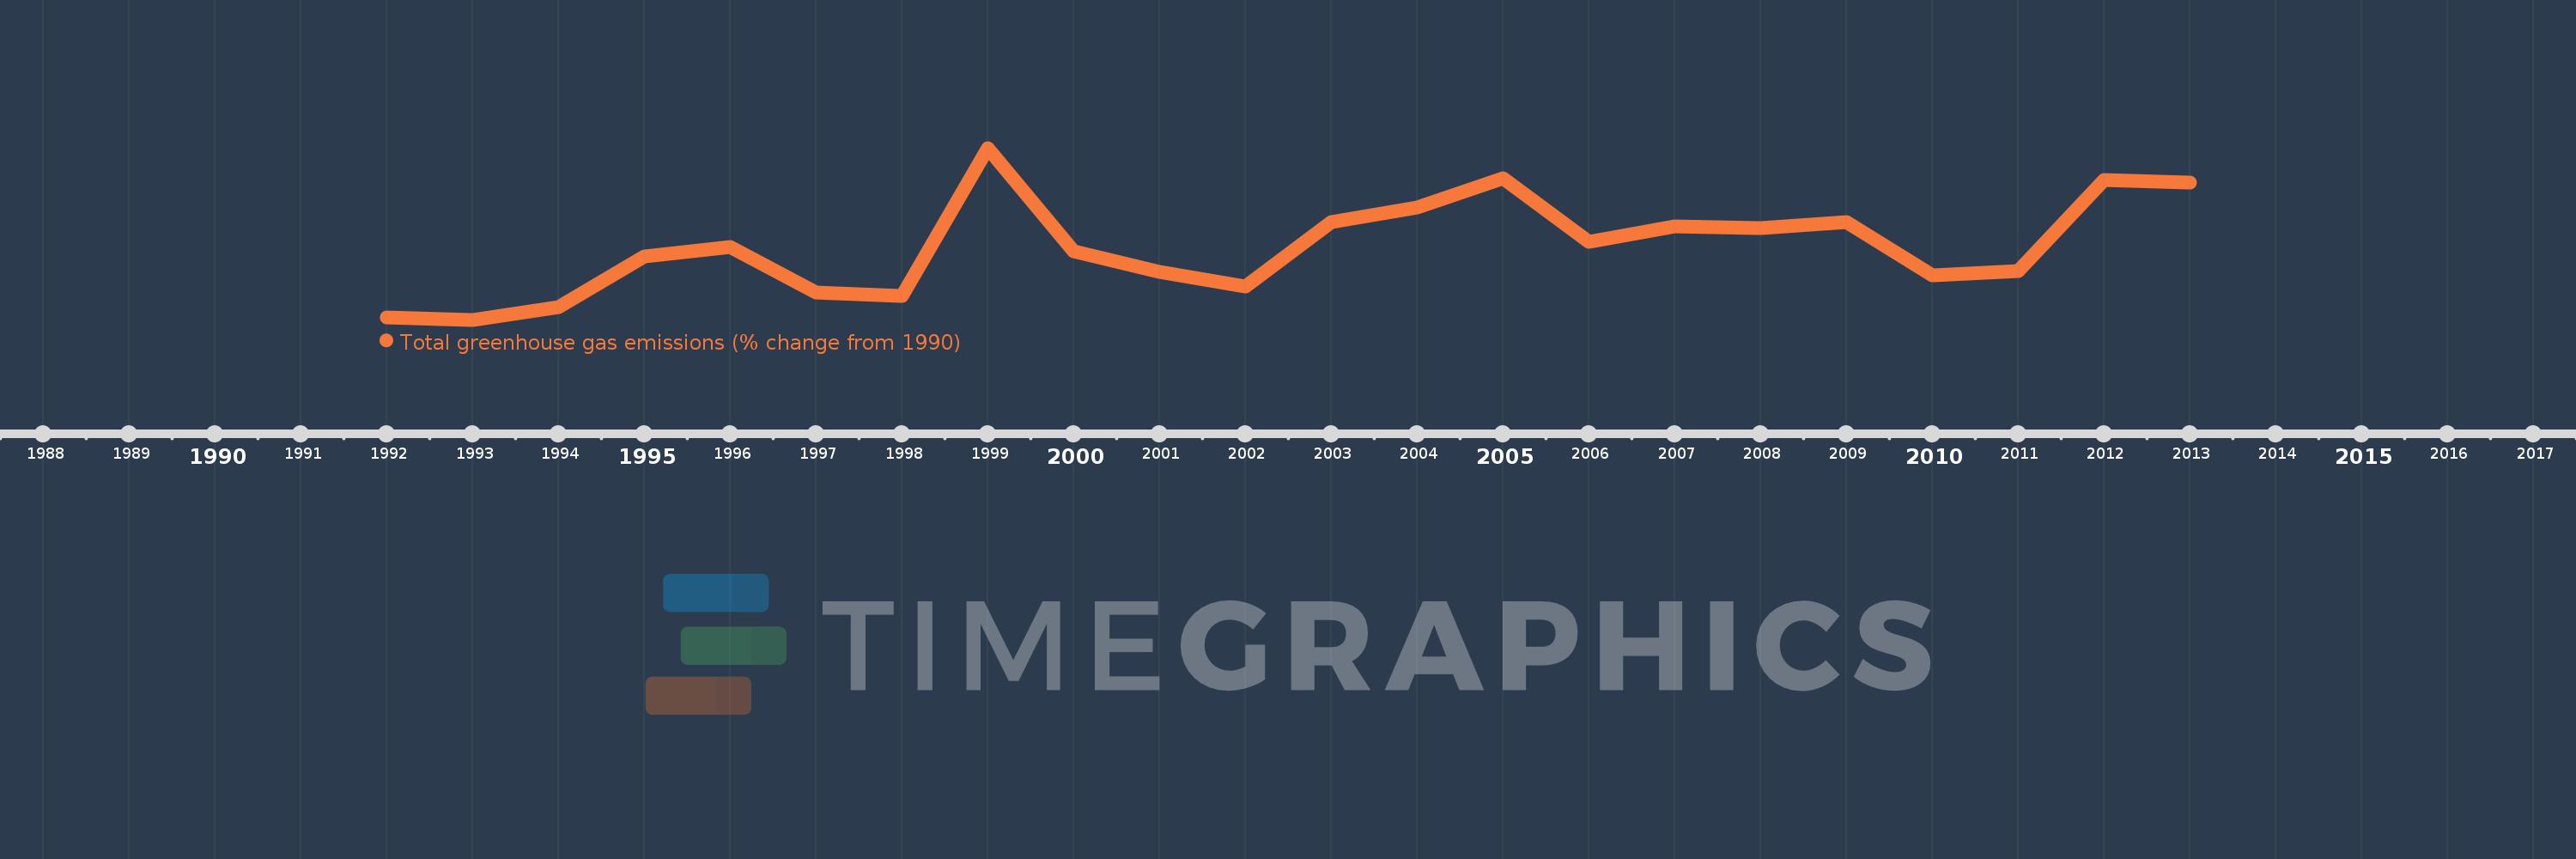
This timeline shows a graph from 1992 to 2013 of Canada. No data until 1991. Number of actual observations by date: 22.
Source name:
World Development Indicators
Source organization:
World Bank staff estimates from original source: European Commission, Joint Research Centre (JRC)/Netherlands Environmental Assessment Agency (PBL). Emission Database for Global Atmospheric Research (EDGAR): http://edgar.jrc.ec.europa.eu/.
Categories, topics:
Climate Change, Environment
Last updated:
apr 23, 2017
Indicators value changes by year
Meaning:
37.277
Minimum:
1.641
jan 1, 1993
Maximum:
85.496
jan 1, 1999
At the date of observation
Value
Absolute change
Change from the previous value
jan 1, 1992
2.869
+2.869
0.0%
jan 1, 1993
1.641
-1.228
-42.81%
jan 1, 1994
7.707
+6.066
369.62%
jan 1, 1995
32.617
+24.911
323.24%
jan 1, 1996
37.349
+4.732
14.51%
jan 1, 1997
14.799
-22.551
-60.38%
jan 1, 1998
13.37
-1.428
-9.65%
jan 1, 1999
85.496
+72.126
539.44%
jan 1, 2000
34.979
-50.518
-59.09%
jan 1, 2001
24.965
-10.014
-28.63%
jan 1, 2002
18.047
-6.918
-27.71%
jan 1, 2003
49.287
+31.24
173.1%
jan 1, 2004
56.3
+7.013
14.23%
jan 1, 2005
70.883
+14.583
25.9%
jan 1, 2006
39.612
-31.27
-44.12%
jan 1, 2007
47.026
+7.413
18.71%
jan 1, 2008
46.556
-0.469
-1.0%
jan 1, 2009
49.326
+2.77
5.95%
jan 1, 2010
23.194
-26.132
-52.98%
jan 1, 2011
25.539
+2.345
10.11%
jan 1, 2012
69.789
+44.25
173.26%
jan 1, 2013
68.735
-1.054
-1.51%
Ranking of countries by current statistics by years
