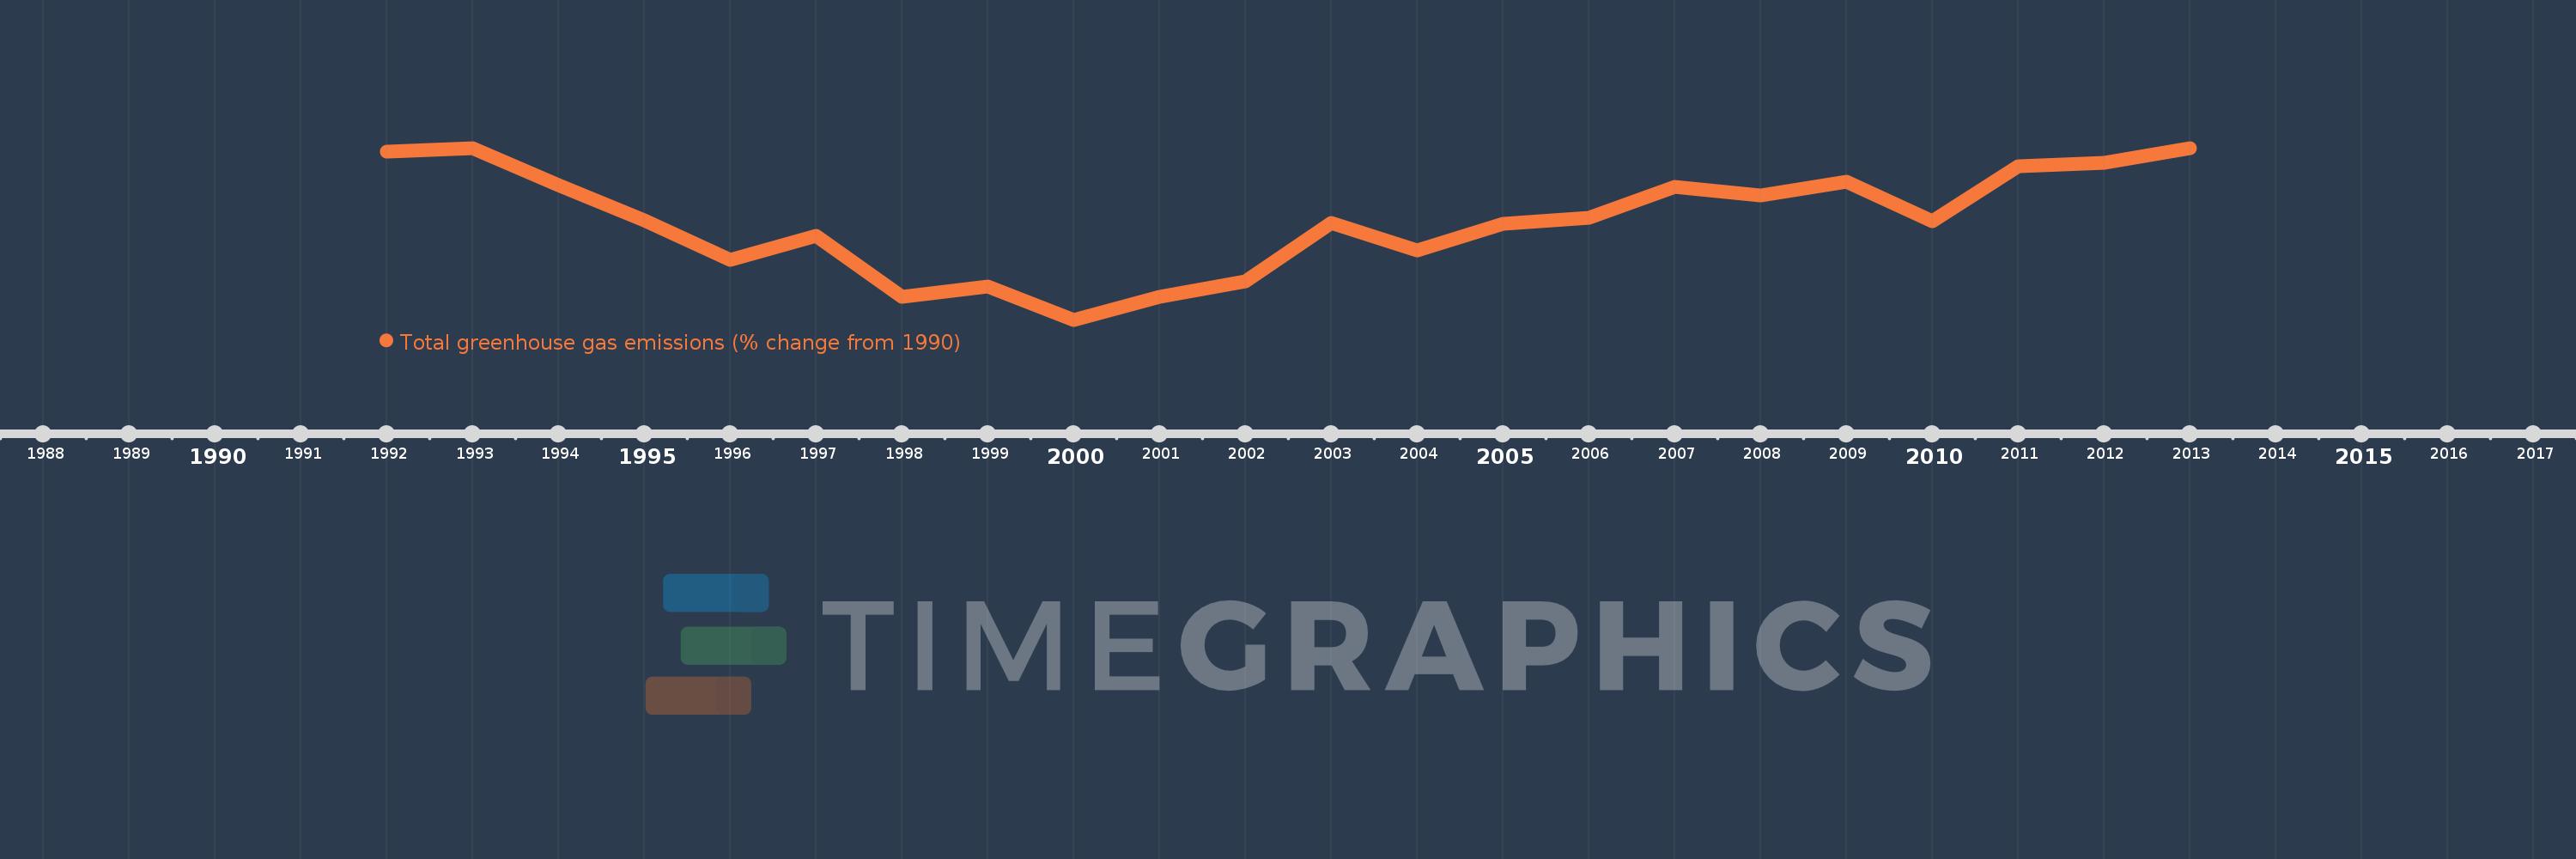
This timeline shows a graph from 1992 to 2013 of Kazakhstan. No data until 1991. Number of actual observations by date: 22.
Source name:
World Development Indicators
Source organization:
World Bank staff estimates from original source: European Commission, Joint Research Centre (JRC)/Netherlands Environmental Assessment Agency (PBL). Emission Database for Global Atmospheric Research (EDGAR): http://edgar.jrc.ec.europa.eu/.
Categories, topics:
Climate Change, Environment
Last updated:
apr 23, 2017
Indicators value changes by year
Meaning:
-22.51
Minimum:
-50.893
jan 1, 2000
Maximum:
-1.555
jan 1, 2013
At the date of observation
Value
Absolute change
Change from the previous value
jan 1, 1992
-2.531
-2.531
0.0%
jan 1, 1993
-1.671
+0.86
-33.96%
jan 1, 1994
-12.177
-10.506
628.58%
jan 1, 1995
-22.413
-10.236
84.06%
jan 1, 1996
-33.582
-11.169
49.83%
jan 1, 1997
-26.851
+6.732
-20.05%
jan 1, 1998
-44.316
-17.466
65.05%
jan 1, 1999
-41.322
+2.994
-6.76%
jan 1, 2000
-50.893
-9.572
23.16%
jan 1, 2001
-44.292
+6.601
-12.97%
jan 1, 2002
-39.938
+4.355
-9.83%
jan 1, 2003
-23.209
+16.728
-41.89%
jan 1, 2004
-31.022
-7.813
33.66%
jan 1, 2005
-23.394
+7.628
-24.59%
jan 1, 2006
-21.663
+1.731
-7.4%
jan 1, 2007
-12.753
+8.91
-41.13%
jan 1, 2008
-15.163
-2.41
18.9%
jan 1, 2009
-11.222
+3.941
-25.99%
jan 1, 2010
-22.695
-11.472
102.23%
jan 1, 2011
-6.698
+15.997
-70.49%
jan 1, 2012
-5.86
+0.838
-12.51%
jan 1, 2013
-1.555
+4.305
-73.46%
Ranking of countries by current statistics by years
