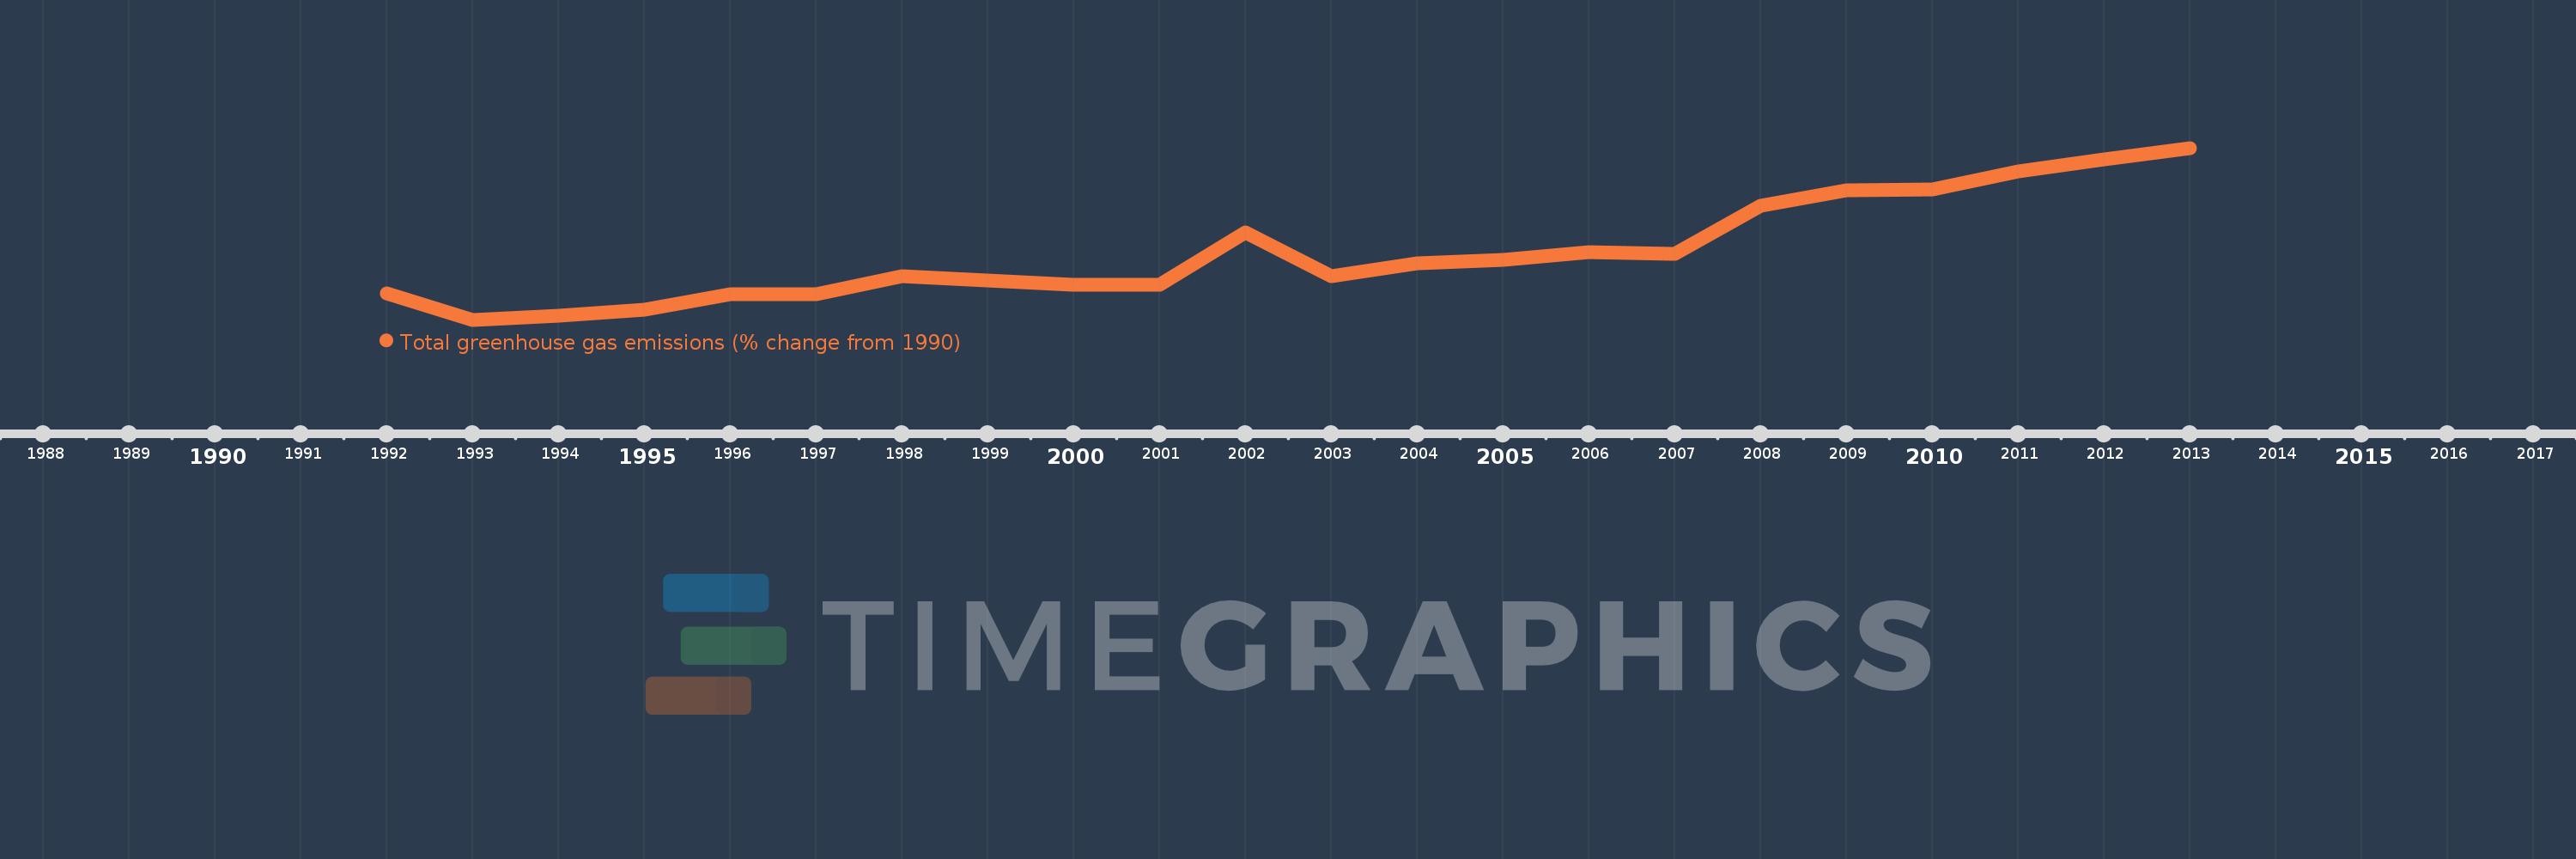
This timeline shows a graph from 1992 to 2013 of Djibouti. No data until 1991. Number of actual observations by date: 22.
Source name:
World Development Indicators
Source organization:
World Bank staff estimates from original source: European Commission, Joint Research Centre (JRC)/Netherlands Environmental Assessment Agency (PBL). Emission Database for Global Atmospheric Research (EDGAR): http://edgar.jrc.ec.europa.eu/.
Categories, topics:
Climate Change, Environment
Last updated:
apr 23, 2017
Indicators value changes by year
Meaning:
18.458
Minimum:
-2.993
jan 1, 1993
Maximum:
51.862
jan 1, 2013
At the date of observation
Value
Absolute change
Change from the previous value
jan 1, 1992
5.419
+5.419
0.0%
jan 1, 1993
-2.993
-8.412
-155.23%
jan 1, 1994
-1.726
+1.267
-42.33%
jan 1, 1995
0.189
+1.915
-110.96%
jan 1, 1996
5.096
+4.907
2.59K%
jan 1, 1997
5.174
+0.078
1.53%
jan 1, 1998
10.796
+5.622
108.65%
jan 1, 1999
9.497
-1.299
-12.03%
jan 1, 2000
8.253
-1.243
-13.09%
jan 1, 2001
8.101
-0.152
-1.84%
jan 1, 2002
24.831
+16.729
206.49%
jan 1, 2003
10.838
-13.993
-56.35%
jan 1, 2004
15.0
+4.162
38.4%
jan 1, 2005
16.156
+1.157
7.71%
jan 1, 2006
18.58
+2.423
15.0%
jan 1, 2007
18.019
-0.561
-3.02%
jan 1, 2008
33.533
+15.514
86.1%
jan 1, 2009
38.262
+4.729
14.1%
jan 1, 2010
38.517
+0.255
0.67%
jan 1, 2011
44.37
+5.853
15.2%
jan 1, 2012
48.311
+3.941
8.88%
jan 1, 2013
51.862
+3.551
7.35%
Ranking of countries by current statistics by years
