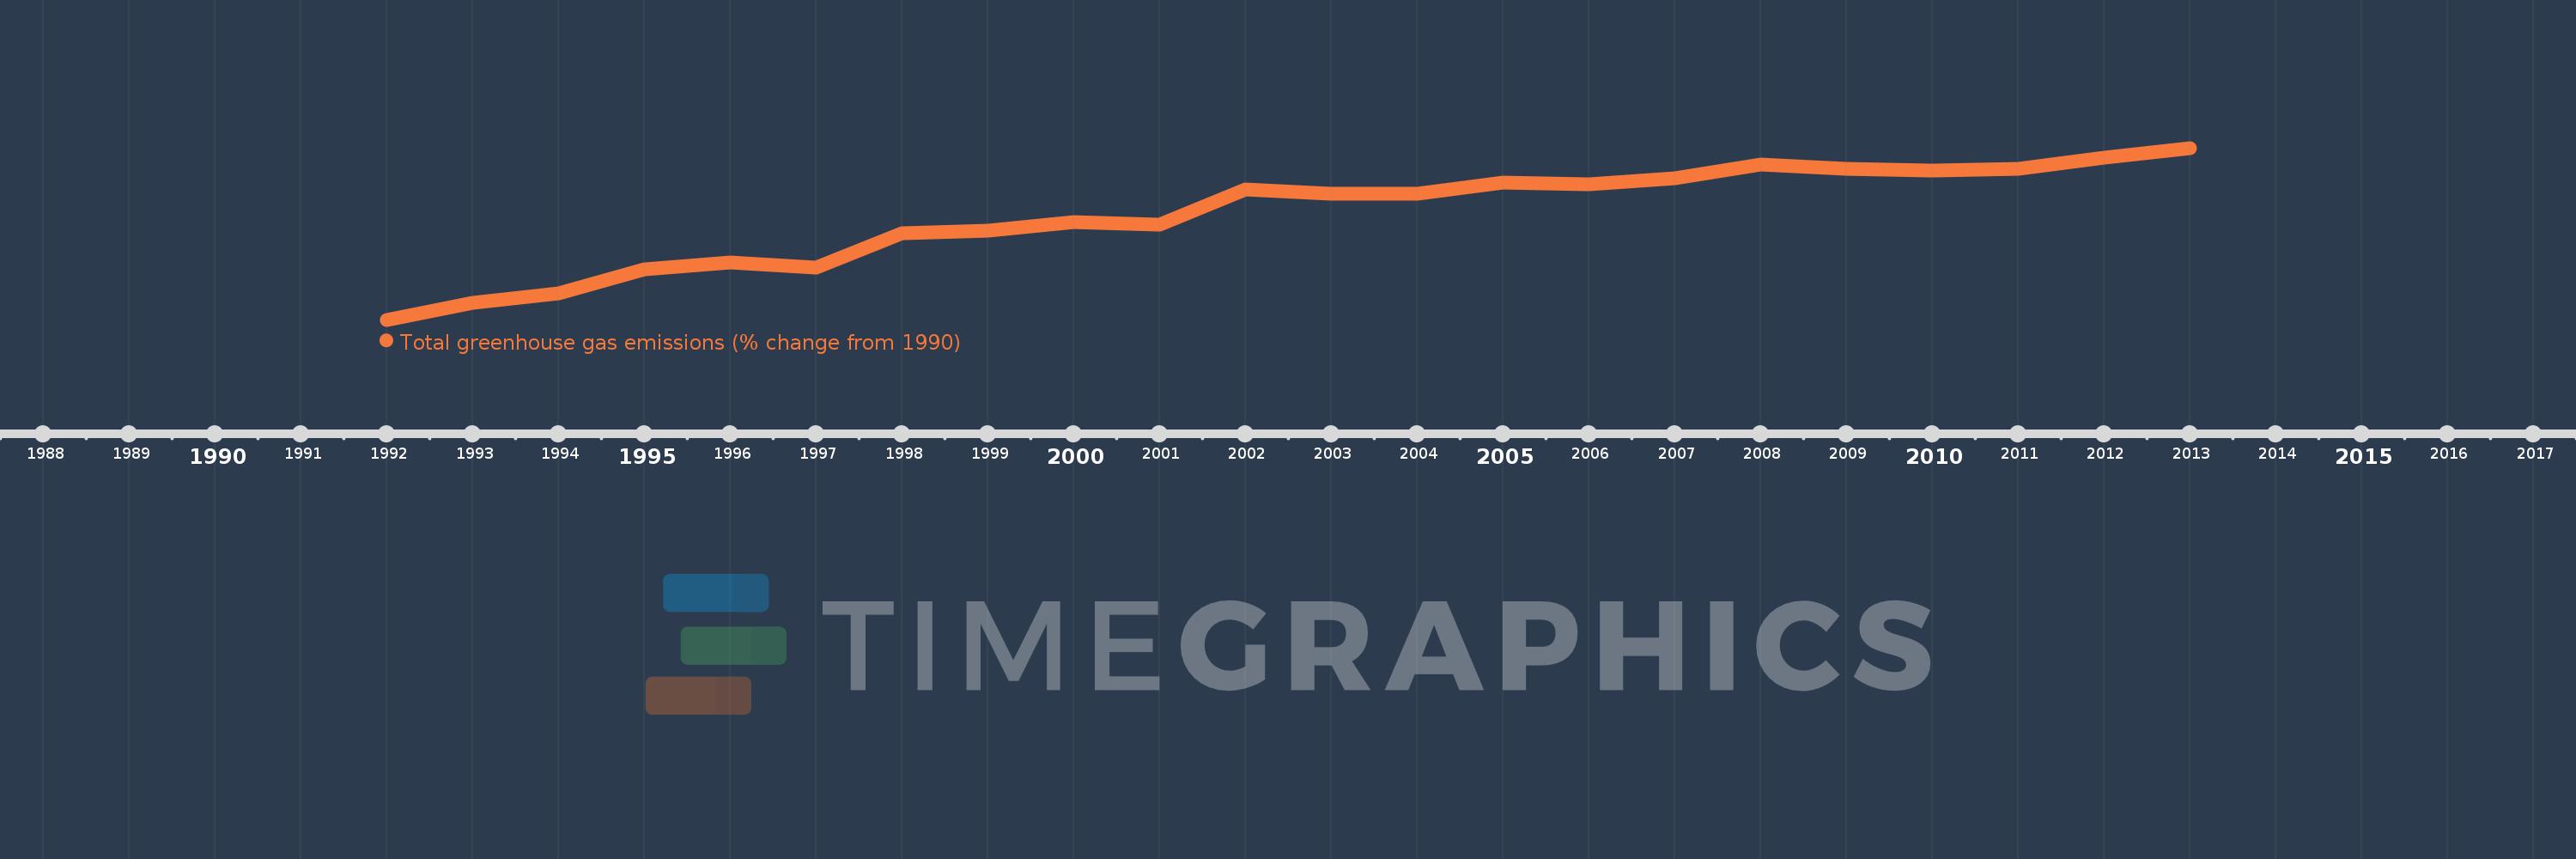
This timeline shows a graph from 1992 to 2013 of El Salvador. No data until 1991. Number of actual observations by date: 22.
Source name:
World Development Indicators
Source organization:
World Bank staff estimates from original source: European Commission, Joint Research Centre (JRC)/Netherlands Environmental Assessment Agency (PBL). Emission Database for Global Atmospheric Research (EDGAR): http://edgar.jrc.ec.europa.eu/.
Categories, topics:
Climate Change, Environment
Last updated:
apr 23, 2017
Indicators value changes by year
Meaning:
58.921
Minimum:
13.059
jan 1, 1992
Maximum:
88.13
jan 1, 2013
At the date of observation
Value
Absolute change
Change from the previous value
jan 1, 1992
13.059
+13.059
0.0%
jan 1, 1993
20.33
+7.271
55.67%
jan 1, 1994
24.494
+4.165
20.49%
jan 1, 1995
34.992
+10.498
42.86%
jan 1, 1996
38.266
+3.274
9.36%
jan 1, 1997
35.799
-2.467
-6.45%
jan 1, 1998
50.719
+14.92
41.68%
jan 1, 1999
52.066
+1.347
2.66%
jan 1, 2000
55.644
+3.578
6.87%
jan 1, 2001
54.73
-0.914
-1.64%
jan 1, 2002
69.93
+15.199
27.77%
jan 1, 2003
68.162
-1.768
-2.53%
jan 1, 2004
68.289
+0.127
0.19%
jan 1, 2005
73.189
+4.9
7.18%
jan 1, 2006
72.431
-0.758
-1.04%
jan 1, 2007
74.859
+2.428
3.35%
jan 1, 2008
80.773
+5.914
7.9%
jan 1, 2009
79.183
-1.59
-1.97%
jan 1, 2010
78.165
-1.019
-1.29%
jan 1, 2011
79.171
+1.007
1.29%
jan 1, 2012
83.879
+4.708
5.95%
jan 1, 2013
88.13
+4.251
5.07%
Ranking of countries by current statistics by years
