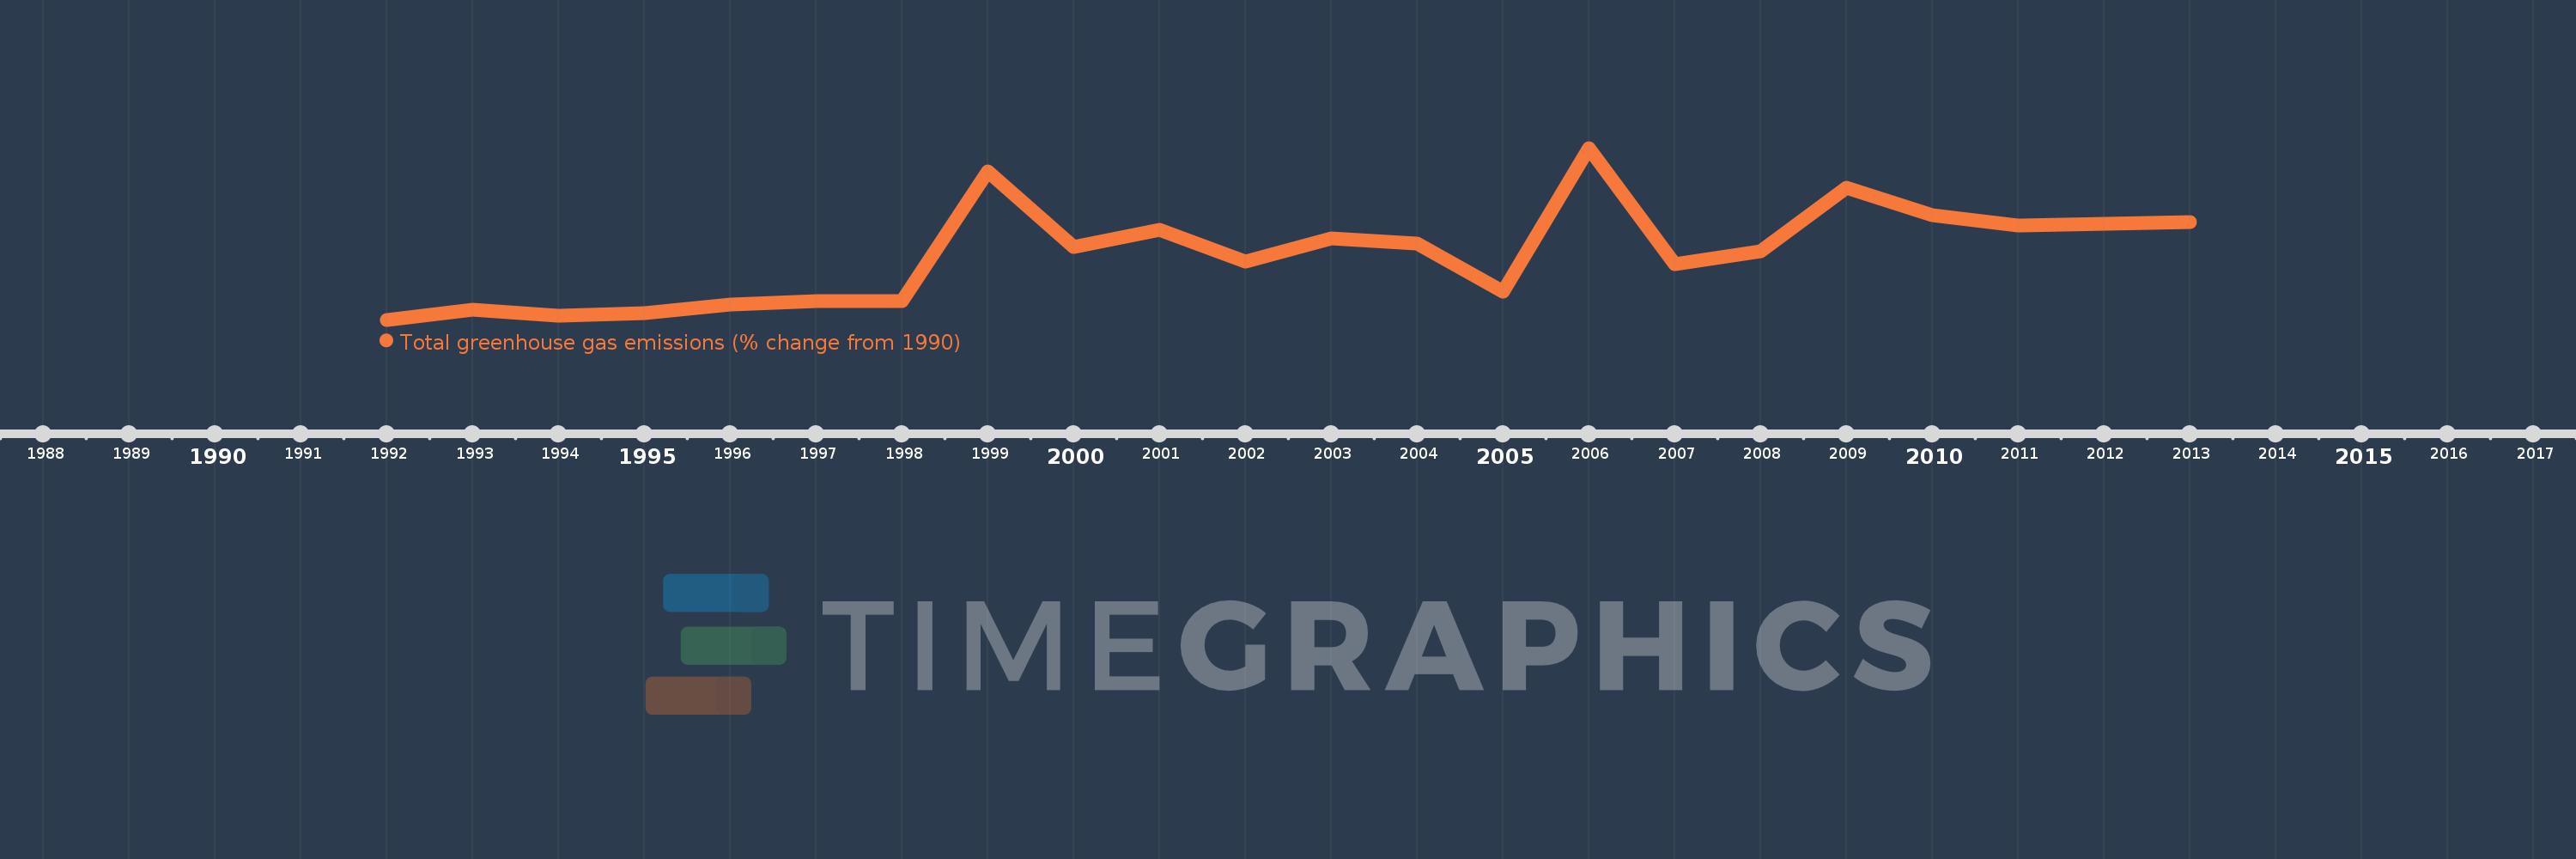
This timeline shows a graph from 1992 to 2013 of Togo. No data until 1991. Number of actual observations by date: 22.
Source name:
World Development Indicators
Source organization:
World Bank staff estimates from original source: European Commission, Joint Research Centre (JRC)/Netherlands Environmental Assessment Agency (PBL). Emission Database for Global Atmospheric Research (EDGAR): http://edgar.jrc.ec.europa.eu/.
Categories, topics:
Climate Change, Environment
Last updated:
apr 23, 2017
Indicators value changes by year
Meaning:
42.005
Minimum:
-18.359
jan 1, 1992
Maximum:
139.227
jan 1, 2006
At the date of observation
Value
Absolute change
Change from the previous value
jan 1, 1992
-18.359
-18.359
0.0%
jan 1, 1993
-9.218
+9.141
-49.79%
jan 1, 1994
-15.03
-5.812
63.05%
jan 1, 1995
-12.229
+2.8
-18.63%
jan 1, 1996
-4.702
+7.527
-61.55%
jan 1, 1997
-1.653
+3.049
-64.85%
jan 1, 1998
-1.377
+0.276
-16.7%
jan 1, 1999
117.725
+119.102
-8.65K%
jan 1, 2000
48.379
-69.346
-58.91%
jan 1, 2001
64.462
+16.082
33.24%
jan 1, 2002
34.954
-29.507
-45.78%
jan 1, 2003
56.525
+21.571
61.71%
jan 1, 2004
51.554
-4.971
-8.79%
jan 1, 2005
7.291
-44.263
-85.86%
jan 1, 2006
139.227
+131.936
1.81K%
jan 1, 2007
32.348
-106.879
-76.77%
jan 1, 2008
44.591
+12.243
37.85%
jan 1, 2009
102.637
+58.046
130.18%
jan 1, 2010
77.894
-24.742
-24.11%
jan 1, 2011
68.365
-9.53
-12.23%
jan 1, 2012
69.726
+1.361
1.99%
jan 1, 2013
71.002
+1.277
1.83%
Ranking of countries by current statistics by years
