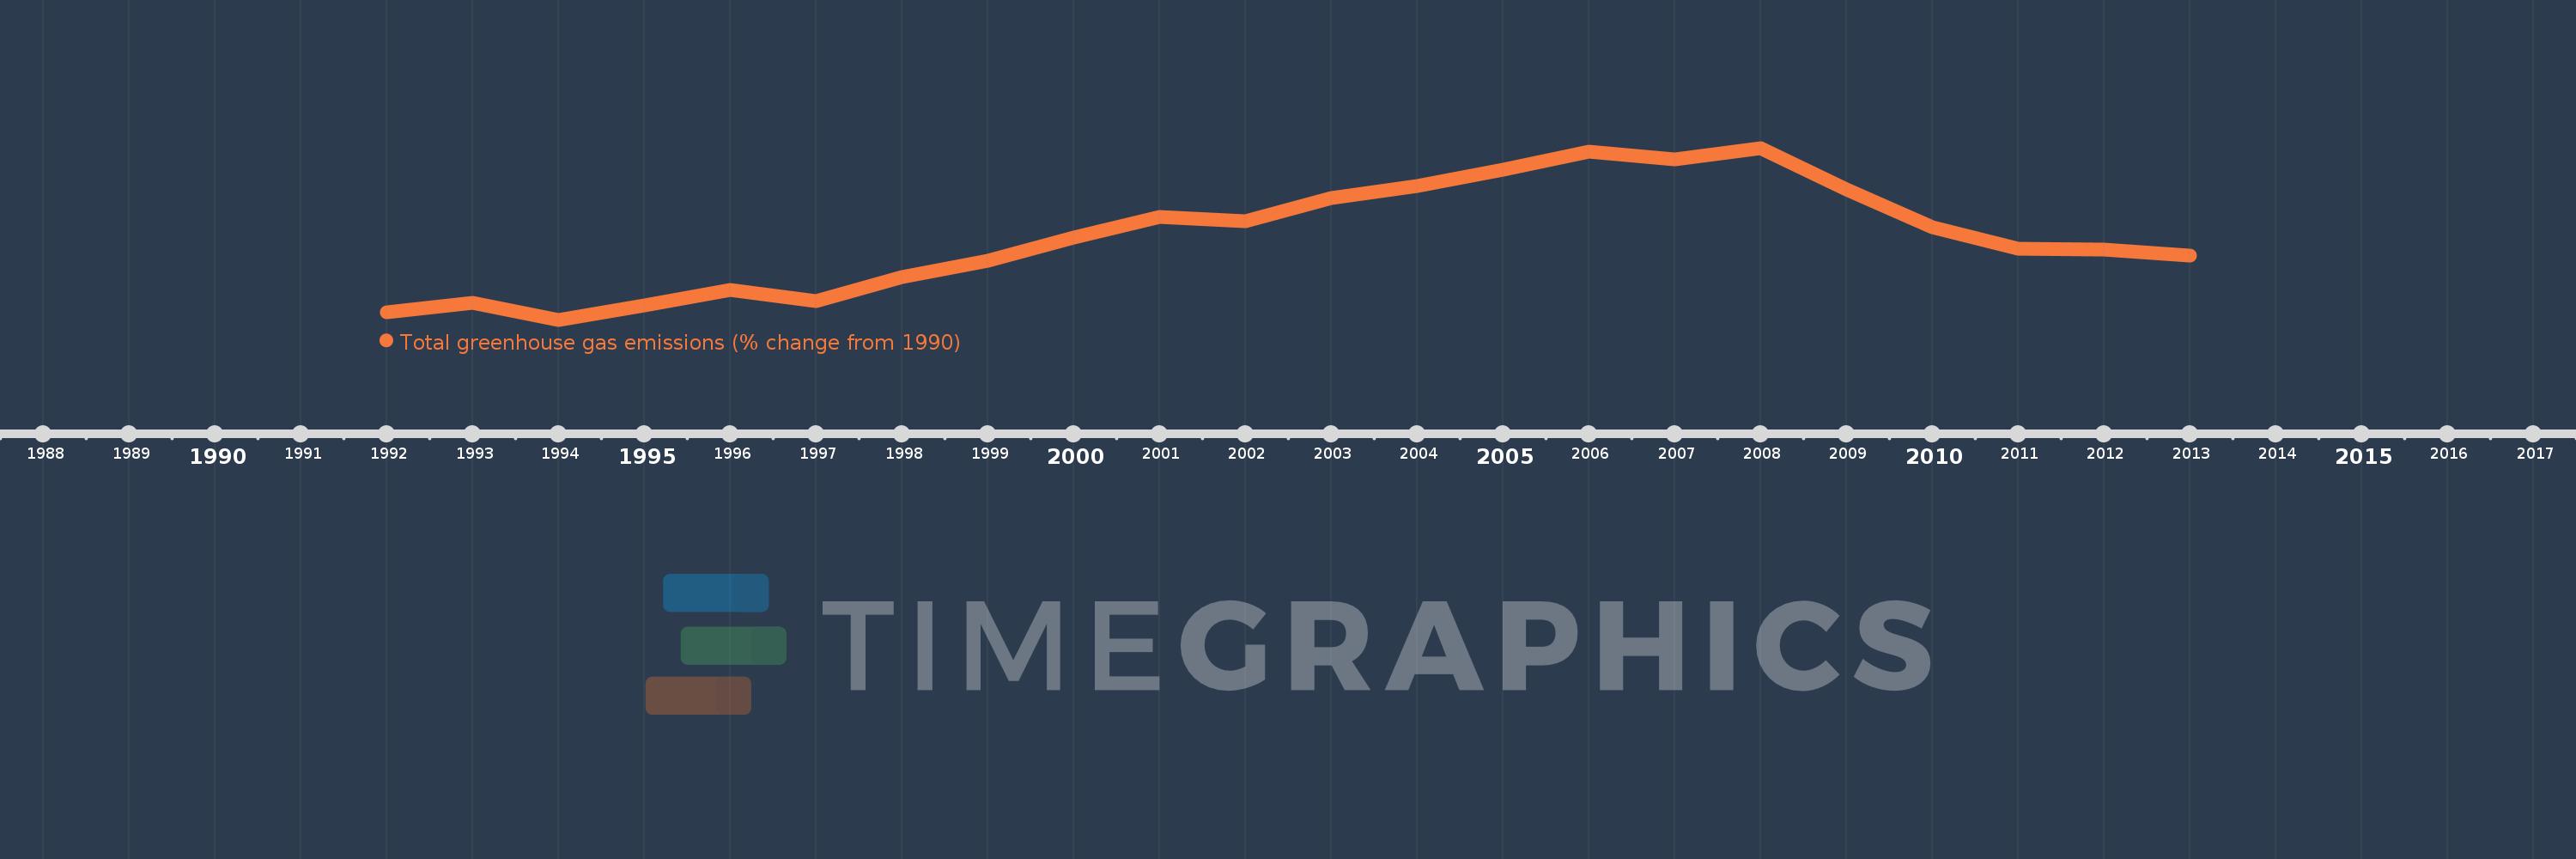
This timeline shows a graph from 1992 to 2013 of Spain. No data until 1991. Number of actual observations by date: 22.
Source name:
World Development Indicators
Source organization:
World Bank staff estimates from original source: European Commission, Joint Research Centre (JRC)/Netherlands Environmental Assessment Agency (PBL). Emission Database for Global Atmospheric Research (EDGAR): http://edgar.jrc.ec.europa.eu/.
Categories, topics:
Climate Change, Environment
Last updated:
apr 23, 2017
Indicators value changes by year
Meaning:
24.0
Minimum:
0.19
jan 1, 1994
Maximum:
49.962
jan 1, 2008
At the date of observation
Value
Absolute change
Change from the previous value
jan 1, 1992
2.467
+2.467
0.0%
jan 1, 1993
5.166
+2.699
109.41%
jan 1, 1994
0.19
-4.976
-96.31%
jan 1, 1995
4.422
+4.232
2.22K%
jan 1, 1996
8.903
+4.481
101.34%
jan 1, 1997
5.605
-3.298
-37.04%
jan 1, 1998
12.466
+6.861
122.4%
jan 1, 1999
17.196
+4.729
37.94%
jan 1, 2000
23.94
+6.744
39.22%
jan 1, 2001
29.893
+5.953
24.86%
jan 1, 2002
28.733
-1.159
-3.88%
jan 1, 2003
35.479
+6.745
23.48%
jan 1, 2004
39.042
+3.563
10.04%
jan 1, 2005
43.555
+4.513
11.56%
jan 1, 2006
48.978
+5.423
12.45%
jan 1, 2007
46.66
-2.318
-4.73%
jan 1, 2008
49.962
+3.302
7.08%
jan 1, 2009
38.019
-11.943
-23.9%
jan 1, 2010
27.094
-10.925
-28.73%
jan 1, 2011
20.888
-6.206
-22.9%
jan 1, 2012
20.629
-0.259
-1.24%
jan 1, 2013
18.72
-1.909
-9.25%
Ranking of countries by current statistics by years
