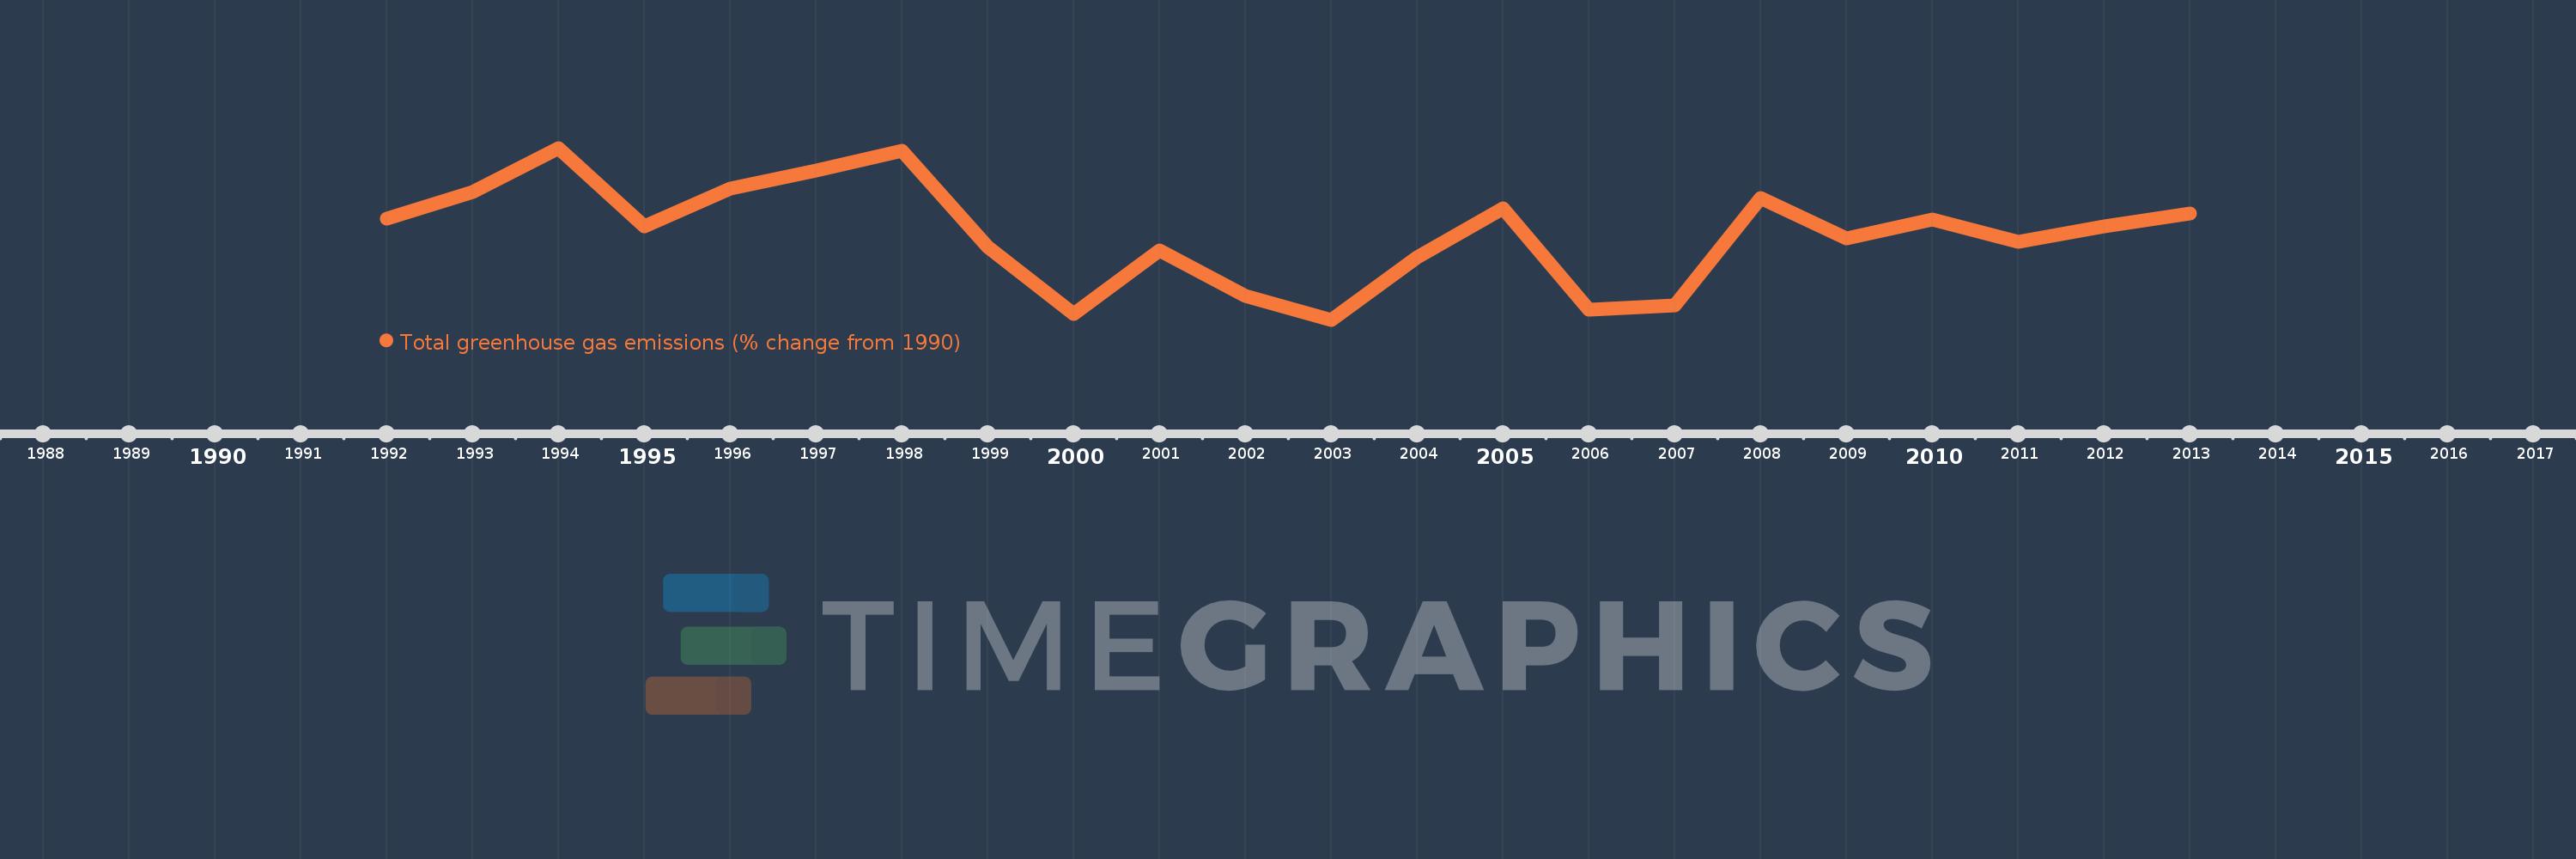
This timeline shows a graph from 1992 to 2013 of Colombia. No data until 1991. Number of actual observations by date: 22.
Source name:
World Development Indicators
Source organization:
World Bank staff estimates from original source: European Commission, Joint Research Centre (JRC)/Netherlands Environmental Assessment Agency (PBL). Emission Database for Global Atmospheric Research (EDGAR): http://edgar.jrc.ec.europa.eu/.
Categories, topics:
Climate Change, Environment
Last updated:
apr 23, 2017
Indicators value changes by year
Meaning:
-3.351
Minimum:
-15.002
jan 1, 2003
Maximum:
8.247
jan 1, 1994
At the date of observation
Value
Absolute change
Change from the previous value
jan 1, 1992
-1.324
-1.324
0.0%
jan 1, 1993
2.338
+3.662
-276.53%
jan 1, 1994
8.247
+5.909
252.77%
jan 1, 1995
-2.34
-10.587
-128.38%
jan 1, 1996
2.698
+5.038
-215.29%
jan 1, 1997
5.187
+2.489
92.25%
jan 1, 1998
7.836
+2.649
51.06%
jan 1, 1999
-5.198
-13.034
-166.34%
jan 1, 2000
-14.241
-9.043
173.97%
jan 1, 2001
-5.663
+8.578
-60.23%
jan 1, 2002
-11.805
-6.142
108.46%
jan 1, 2003
-15.002
-3.197
27.08%
jan 1, 2004
-6.546
+8.456
-56.37%
jan 1, 2005
0.121
+6.668
-101.85%
jan 1, 2006
-13.635
-13.756
-11.33K%
jan 1, 2007
-13.102
+0.533
-3.91%
jan 1, 2008
1.512
+14.615
-111.54%
jan 1, 2009
-3.983
-5.496
-363.42%
jan 1, 2010
-1.425
+2.558
-64.23%
jan 1, 2011
-4.416
-2.991
209.91%
jan 1, 2012
-2.407
+2.009
-45.5%
jan 1, 2013
-0.565
+1.842
-76.53%
Ranking of countries by current statistics by years
