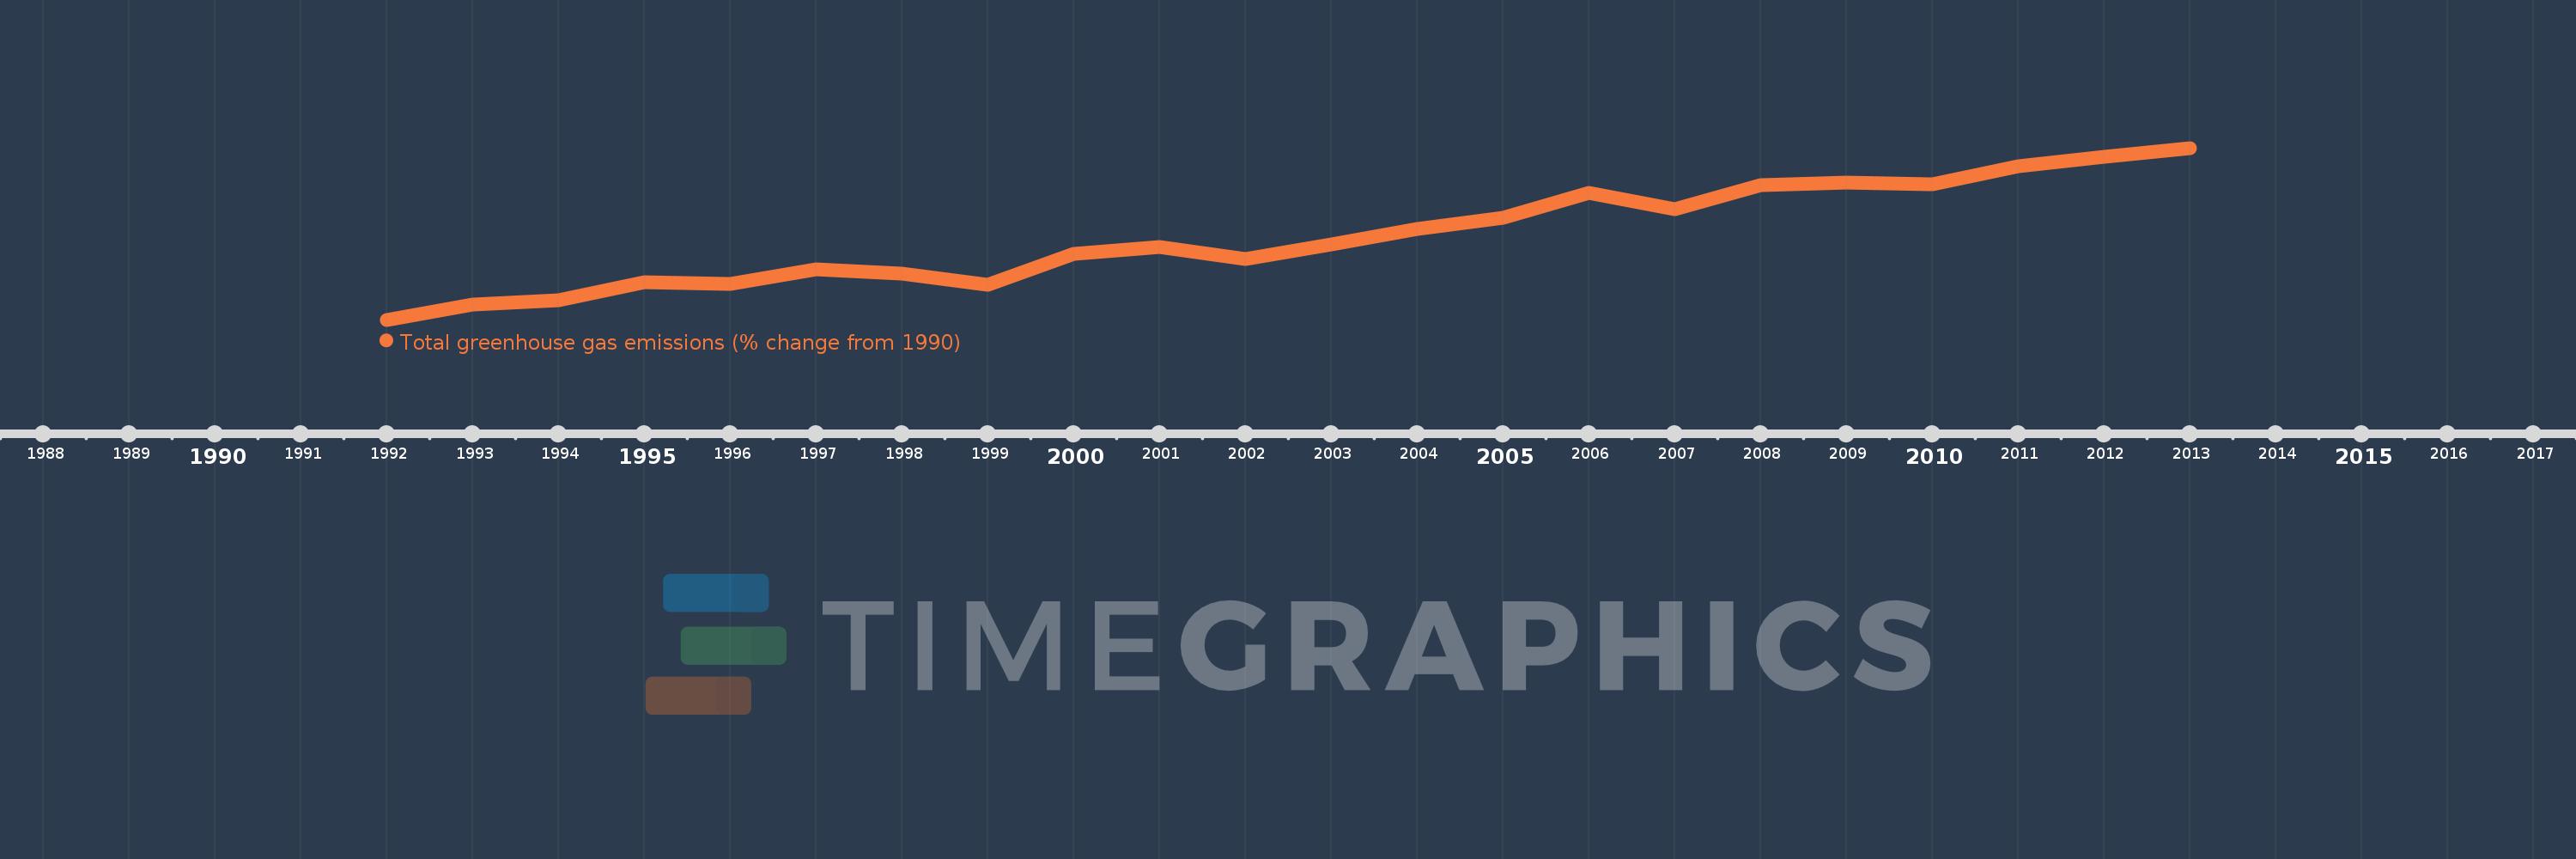
This timeline shows a graph from 1992 to 2013 of Sri Lanka. No data until 1991. Number of actual observations by date: 22.
Source name:
World Development Indicators
Source organization:
World Bank staff estimates from original source: European Commission, Joint Research Centre (JRC)/Netherlands Environmental Assessment Agency (PBL). Emission Database for Global Atmospheric Research (EDGAR): http://edgar.jrc.ec.europa.eu/.
Categories, topics:
Climate Change, Environment
Last updated:
apr 23, 2017
Indicators value changes by year
Meaning:
31.012
Minimum:
-1.893
jan 1, 1992
Maximum:
65.688
jan 1, 2013
At the date of observation
Value
Absolute change
Change from the previous value
jan 1, 1992
-1.893
-1.893
0.0%
jan 1, 1993
4.15
+6.043
-319.18%
jan 1, 1994
5.671
+1.522
36.67%
jan 1, 1995
12.925
+7.254
127.91%
jan 1, 1996
12.145
-0.78
-6.03%
jan 1, 1997
17.97
+5.825
47.96%
jan 1, 1998
16.362
-1.608
-8.95%
jan 1, 1999
11.846
-4.516
-27.6%
jan 1, 2000
24.145
+12.299
103.83%
jan 1, 2001
26.68
+2.535
10.5%
jan 1, 2002
22.037
-4.643
-17.4%
jan 1, 2003
27.672
+5.635
25.57%
jan 1, 2004
33.742
+6.069
21.93%
jan 1, 2005
38.168
+4.427
13.12%
jan 1, 2006
48.122
+9.954
26.08%
jan 1, 2007
41.466
-6.656
-13.83%
jan 1, 2008
51.09
+9.624
23.21%
jan 1, 2009
52.103
+1.013
1.98%
jan 1, 2010
51.404
-0.699
-1.34%
jan 1, 2011
58.503
+7.099
13.81%
jan 1, 2012
62.266
+3.762
6.43%
jan 1, 2013
65.688
+3.423
5.5%
Ranking of countries by current statistics by years
