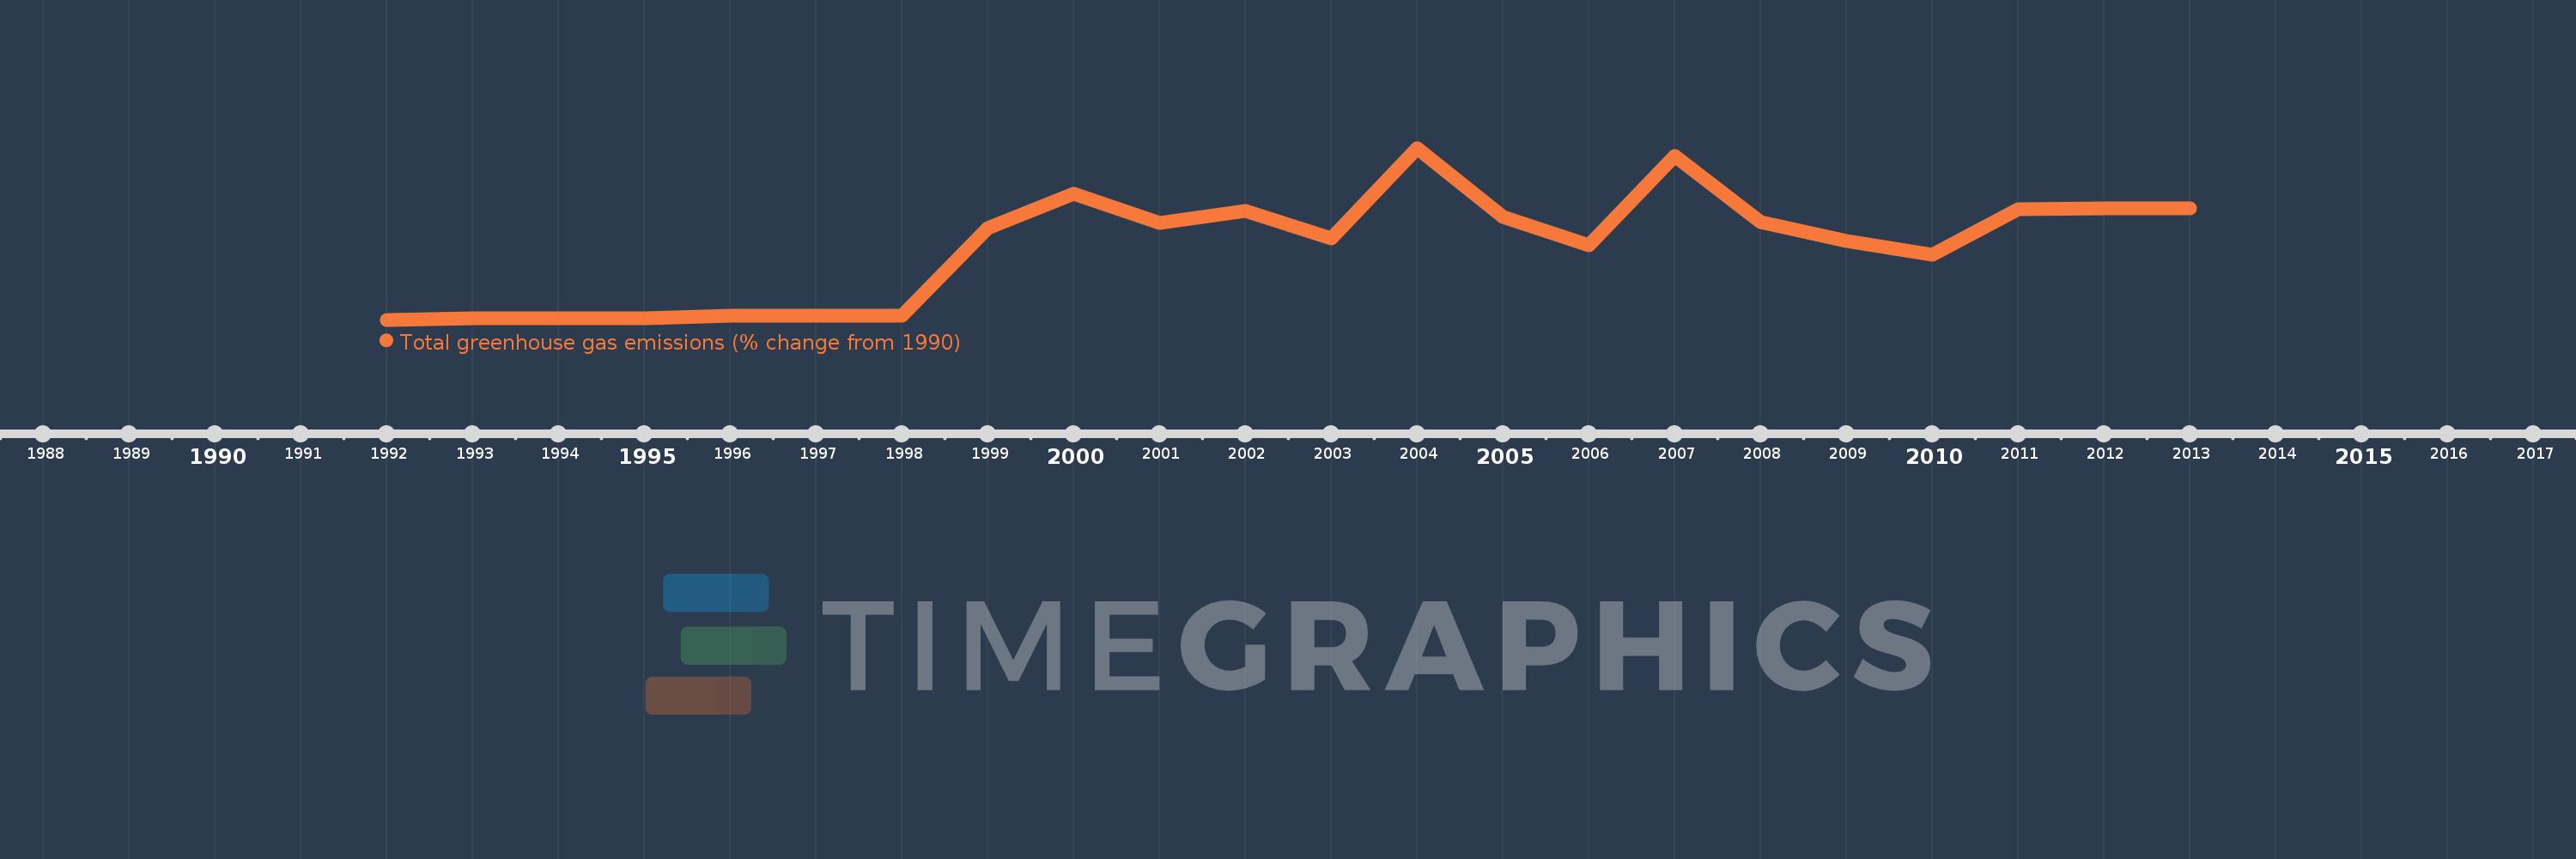
This timeline shows a graph from 1992 to 2013 of Guinea-Bissau. No data until 1991. Number of actual observations by date: 22.
Source name:
World Development Indicators
Source organization:
World Bank staff estimates from original source: European Commission, Joint Research Centre (JRC)/Netherlands Environmental Assessment Agency (PBL). Emission Database for Global Atmospheric Research (EDGAR): http://edgar.jrc.ec.europa.eu/.
Categories, topics:
Climate Change, Environment
Last updated:
apr 23, 2017
Indicators value changes by year
Meaning:
237.485
Minimum:
-8.2
jan 1, 1992
Maximum:
569.025
jan 1, 2004
At the date of observation
Value
Absolute change
Change from the previous value
jan 1, 1992
-8.2
-8.2
0.0%
jan 1, 1993
-2.199
+6.0
-73.18%
jan 1, 1994
-2.955
-0.756
34.36%
jan 1, 1995
-1.853
+1.102
-37.29%
jan 1, 1996
4.436
+6.289
-339.4%
jan 1, 1997
3.944
-0.492
-11.09%
jan 1, 1998
4.932
+0.988
25.05%
jan 1, 1999
299.823
+294.89
5.98K%
jan 1, 2000
415.479
+115.656
38.57%
jan 1, 2001
316.957
-98.522
-23.71%
jan 1, 2002
358.302
+41.345
13.04%
jan 1, 2003
263.863
-94.439
-26.36%
jan 1, 2004
569.025
+305.162
115.65%
jan 1, 2005
337.353
-231.672
-40.71%
jan 1, 2006
242.706
-94.647
-28.06%
jan 1, 2007
542.121
+299.415
123.37%
jan 1, 2008
320.091
-222.029
-40.96%
jan 1, 2009
256.584
-63.507
-19.84%
jan 1, 2010
209.843
-46.741
-18.22%
jan 1, 2011
362.691
+152.848
72.84%
jan 1, 2012
364.828
+2.138
0.59%
jan 1, 2013
366.888
+2.06
0.56%
Ranking of countries by current statistics by years
