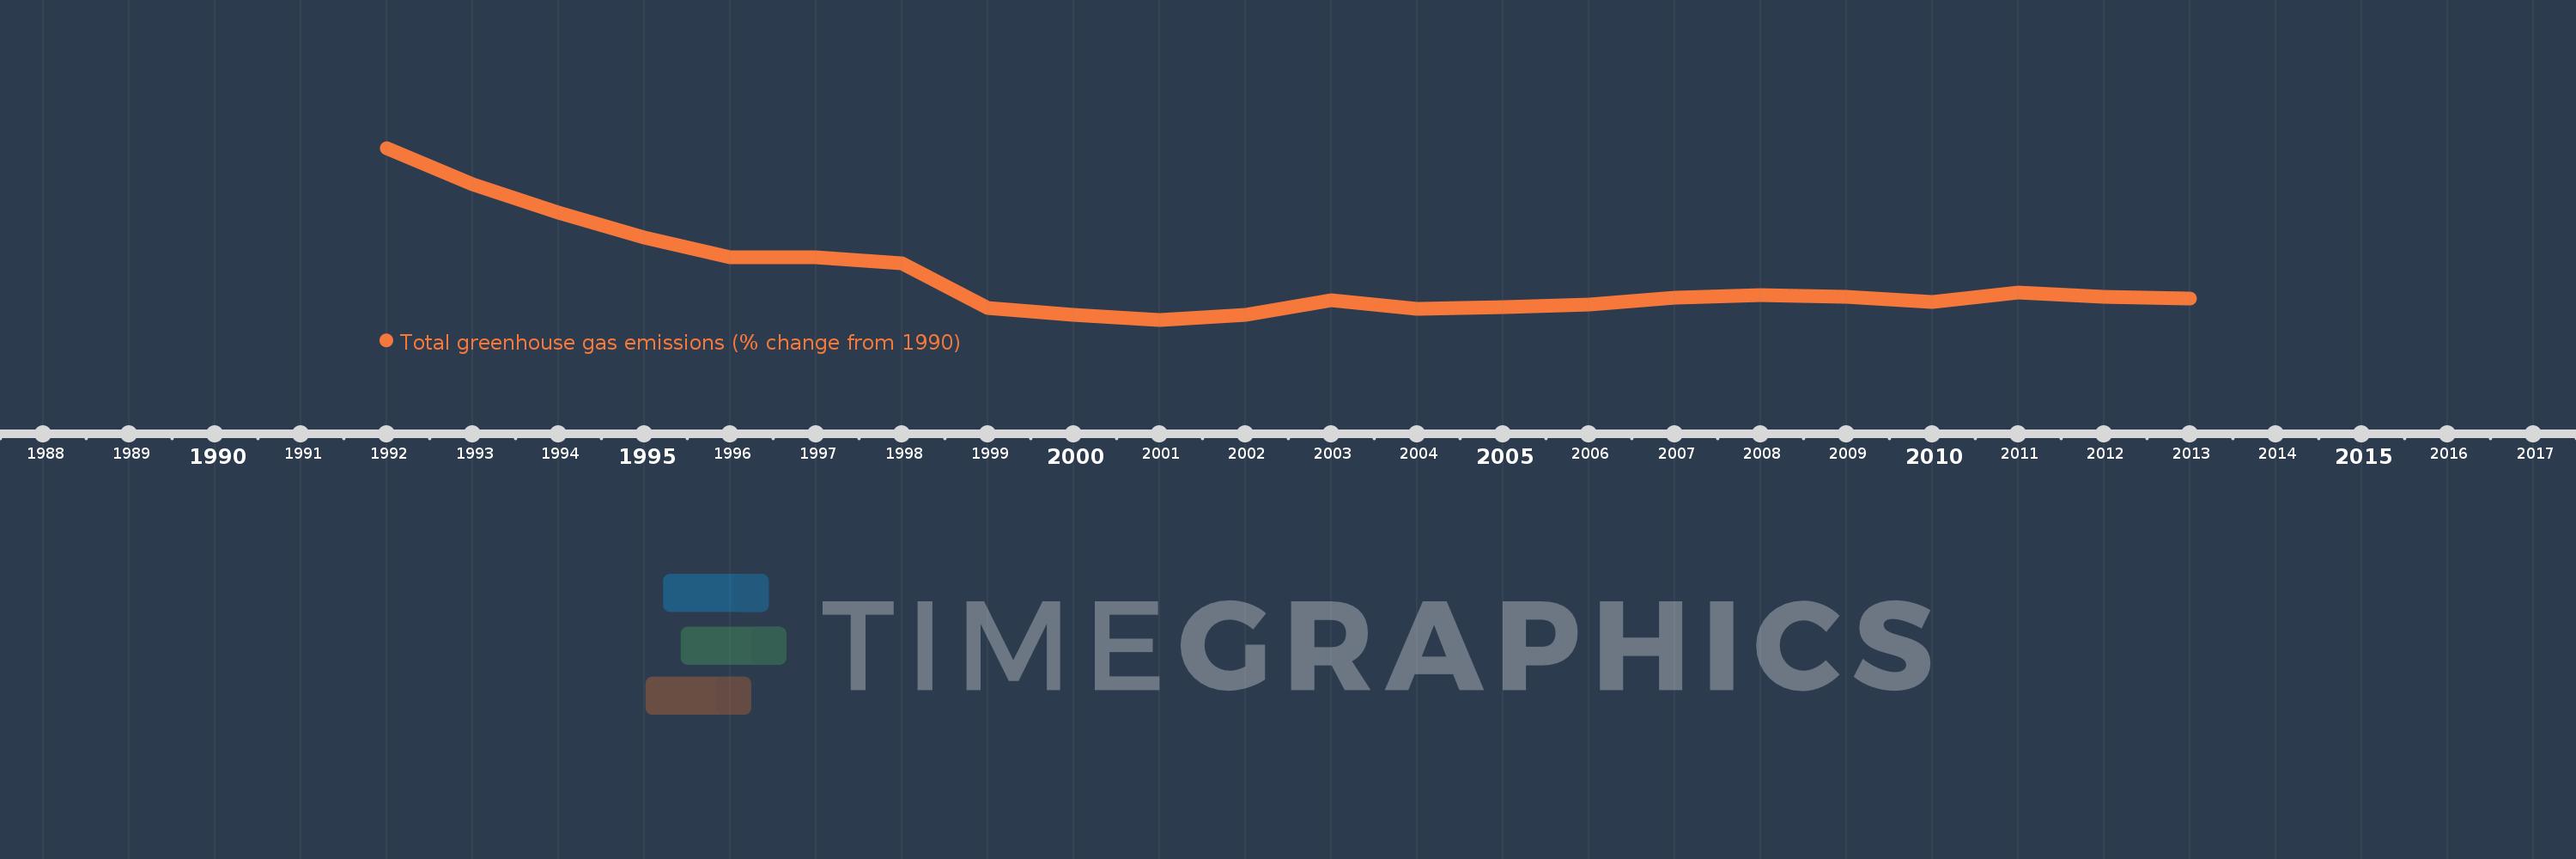
This timeline shows a graph from 1992 to 2013 of Latvia. No data until 1991. Number of actual observations by date: 22.
Source name:
World Development Indicators
Source organization:
World Bank staff estimates from original source: European Commission, Joint Research Centre (JRC)/Netherlands Environmental Assessment Agency (PBL). Emission Database for Global Atmospheric Research (EDGAR): http://edgar.jrc.ec.europa.eu/.
Categories, topics:
Climate Change, Environment
Last updated:
apr 23, 2017
Indicators value changes by year
Meaning:
-51.379
Minimum:
-65.82
jan 1, 2001
Maximum:
-6.203
jan 1, 1992
At the date of observation
Value
Absolute change
Change from the previous value
jan 1, 1992
-6.203
-6.203
0.0%
jan 1, 1993
-18.703
-12.5
201.53%
jan 1, 1994
-28.578
-9.875
52.8%
jan 1, 1995
-37.407
-8.828
30.89%
jan 1, 1996
-44.211
-6.804
18.19%
jan 1, 1997
-44.194
+0.017
-0.04%
jan 1, 1998
-46.384
-2.19
4.96%
jan 1, 1999
-61.667
-15.284
32.95%
jan 1, 2000
-64.131
-2.464
4.0%
jan 1, 2001
-65.82
-1.688
2.63%
jan 1, 2002
-64.091
+1.728
-2.63%
jan 1, 2003
-59.165
+4.927
-7.69%
jan 1, 2004
-62.031
-2.867
4.84%
jan 1, 2005
-61.323
+0.709
-1.14%
jan 1, 2006
-60.531
+0.791
-1.29%
jan 1, 2007
-58.256
+2.276
-3.76%
jan 1, 2008
-57.181
+1.075
-1.84%
jan 1, 2009
-57.809
-0.628
1.1%
jan 1, 2010
-59.664
-1.854
3.21%
jan 1, 2011
-56.427
+3.237
-5.42%
jan 1, 2012
-57.971
-1.544
2.74%
jan 1, 2013
-58.584
-0.612
1.06%
Ranking of countries by current statistics by years
