30
/
AIzaSyAYiBZKx7MnpbEhh9jyipgxe19OcubqV5w
April 1, 2024
180458
Libya
LBY
true
2
1
Total greenhouse gas emissions (% change from 1990)
2013,2012,2011,2010,2009,2008,2007,2006,2005,2004,2003,2002,2001,2000,1999,1998,1997,1996,1995,1994,1993,1992
Download
Global statistics library →Libya →

Total greenhouse gas emissions (% change from 1990)

This statistics in other country:

AfghanistanAlbaniaAlgeriaAmerican SamoaAngolaAntigua and BarbudaArab WorldArgentinaArmeniaAustraliaAustriaAzerbaijanBahamas, TheBahrainBangladeshBarbadosBelarusBelgiumBelizeBeninBermudaBhutanBoliviaBosnia and HerzegovinaBotswanaBrazilBritish Virgin IslandsBrunei DarussalamBulgariaBurkina FasoBurundiCabo VerdeCambodiaCameroonCanadaCaribbean small statesCayman IslandsCentral African RepublicCentral Europe and the BalticsChadChileChinaColombiaComorosCongo, Dem. Rep.Congo, Rep.Costa RicaCote d'IvoireCroatiaCubaCyprusCzech RepublicDenmarkDjiboutiDominicaDominican RepublicEarly-demographic dividendEast Asia & PacificEast Asia & Pacific (excluding high income)East Asia & Pacific (IDA & IBRD countries)EcuadorEgypt, Arab Rep.El SalvadorEquatorial GuineaEritreaEstoniaEthiopiaEuro areaEurope & Central AsiaEurope & Central Asia (excluding high income)Europe & Central Asia (IDA & IBRD countries)European UnionFijiFinlandFragile and conflict affected situationsFranceFrench PolynesiaGabonGambia, TheGeorgiaGermanyGhanaGibraltarGreeceGrenadaGuamGuatemalaGuineaGuinea-BissauGuyanaHaitiHeavily indebted poor countries (HIPC)High incomeHondurasHong Kong SAR, ChinaHungaryIBRD onlyIcelandIDA & IBRD totalIDA blendIDA onlyIDA totalIndiaIndonesiaIran, Islamic Rep.IraqIrelandIsraelItalyJamaicaJapanJordanKazakhstanKenyaKiribatiKorea, Dem. People’s Rep.Korea, Rep.Kyrgyz RepublicLao PDRLate-demographic dividendLatin America & Caribbean Latin America & Caribbean (excluding high income)Latin America & the Caribbean (IDA & IBRD countries)LatviaLeast developed countries: UN classificationLesothoLiberiaLibyaLithuaniaLow & middle incomeLow incomeLower middle incomeLuxembourgMacedonia, FYRMadagascarMalawiMalaysiaMaliMaltaMauritaniaMauritiusMexicoMicronesia, Fed. Sts.Middle East & North AfricaMiddle East & North Africa (excluding high income)Middle East & North Africa (IDA & IBRD countries)Middle incomeMoldovaMongoliaMoroccoMozambiqueMyanmarNamibiaNepalNetherlandsNew CaledoniaNew ZealandNicaraguaNigerNigeriaNorth AmericaNorthern Mariana IslandsNorwayOECD membersOmanOther small statesPacific island small statesPakistanPanamaPapua New GuineaParaguayPeruPhilippinesPolandPortugalPost-demographic dividendPre-demographic dividendPuerto RicoQatarRomaniaRussian FederationRwandaSamoaSao Tome and PrincipeSenegalSeychellesSierra LeoneSlovak RepublicSloveniaSmall statesSolomon IslandsSomaliaSouth AfricaSouth AsiaSouth Asia (IDA & IBRD)SpainSri LankaSt. LuciaSt. Vincent and the GrenadinesSub-Saharan Africa Sub-Saharan Africa (excluding high income)Sub-Saharan Africa (IDA & IBRD countries)SudanSurinameSwazilandSwedenSwitzerlandSyrian Arab RepublicTajikistanTanzaniaThailandTimor-LesteTogoTongaTunisiaTurkeyTurkmenistanTurks and Caicos IslandsTuvaluUgandaUkraineUnited Arab EmiratesUnited KingdomUnited StatesUpper middle incomeUruguayUzbekistanVanuatuVenezuela, RBVietnamVirgin Islands (U.S.)WorldYemen, Rep.ZambiaZimbabwe

Timeline:

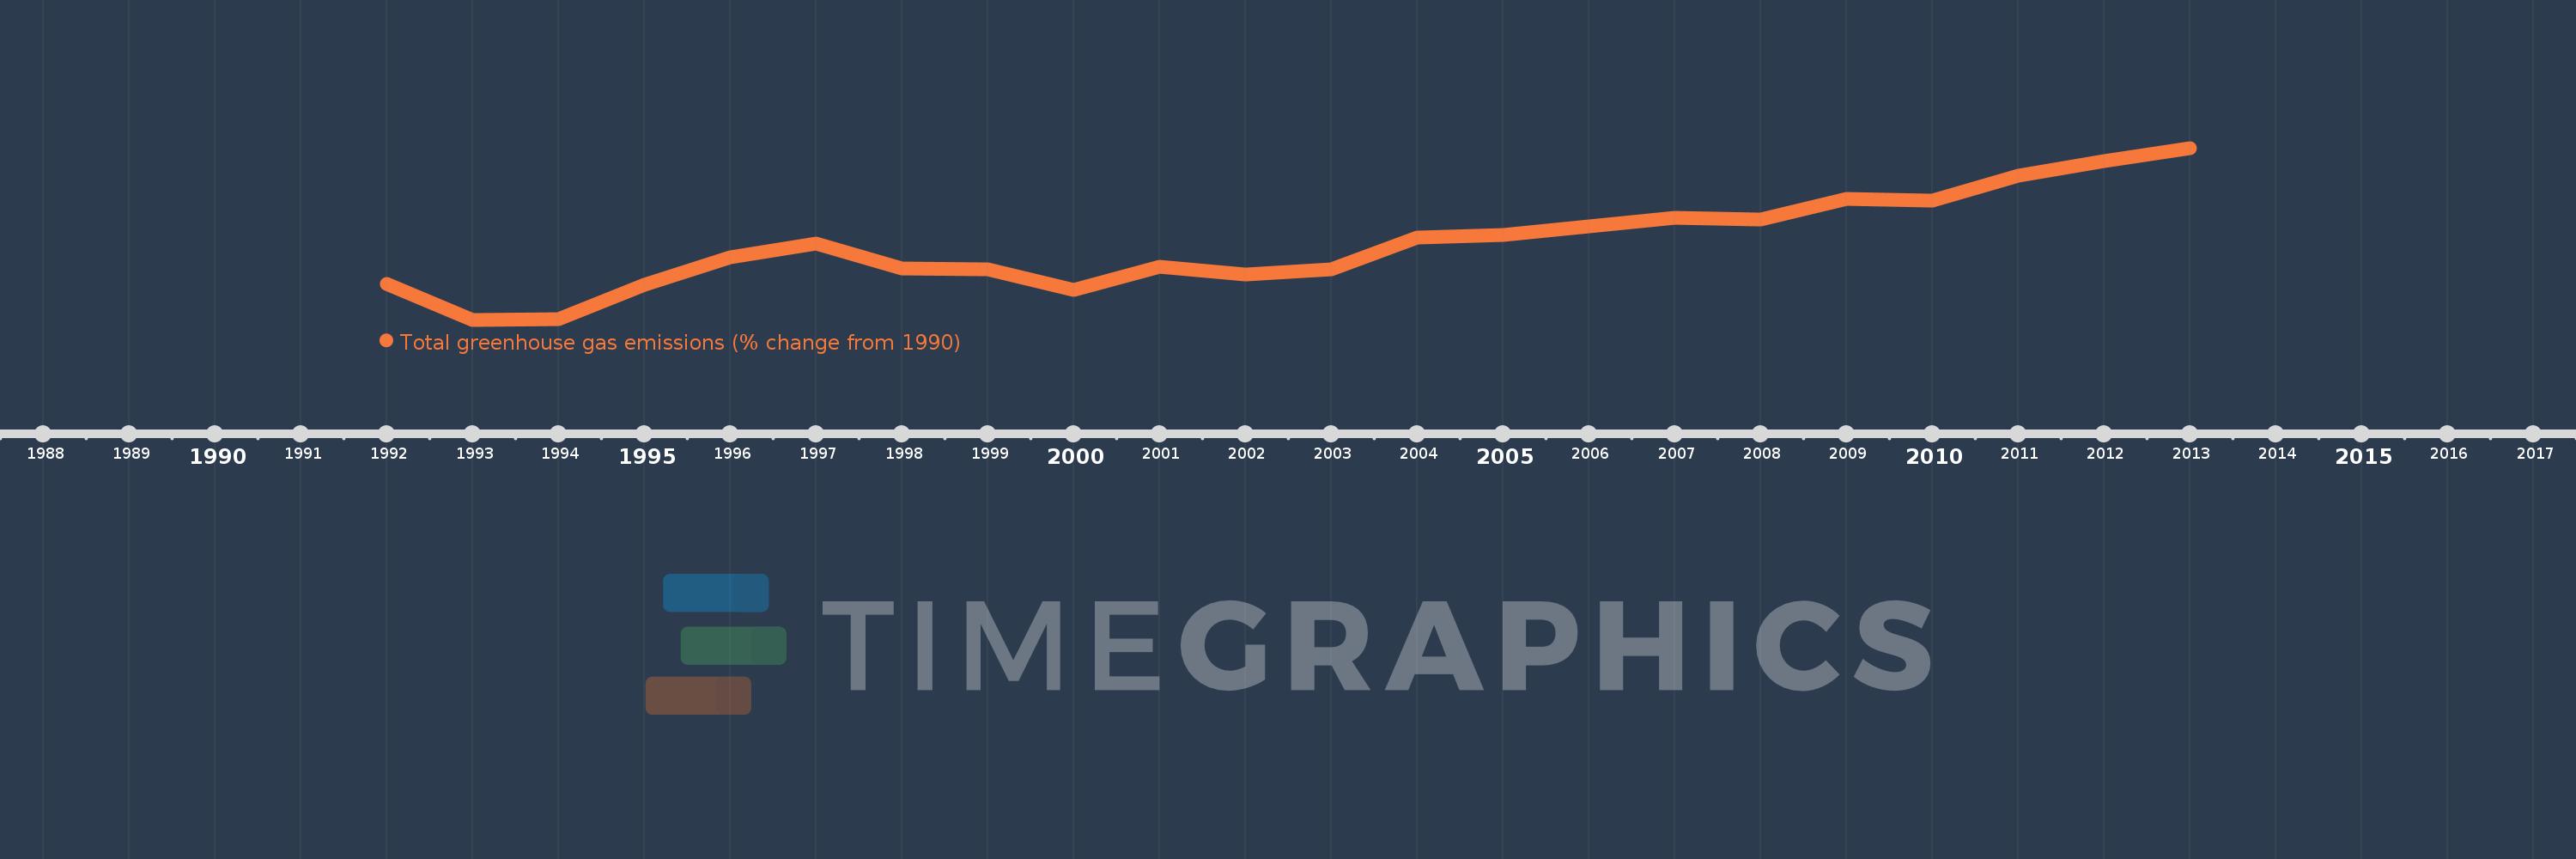
This timeline shows a graph from 1992 to 2013 of Libya. No data until 1991. Number of actual observations by date: 22.

Source name:

World Development Indicators

Source organization:

World Bank staff estimates from original source: European Commission, Joint Research Centre (JRC)/Netherlands Environmental Assessment Agency (PBL). Emission Database for Global Atmospheric Research (EDGAR): http://edgar.jrc.ec.europa.eu/.

Categories, topics:

Climate Change, Environment

Last updated:

apr 23, 2017

Indicators value changes by year

Meaning:
10.093
Minimum:
-9.168
jan 1, 1993
Maximum:
34.474
jan 1, 2013
At the date of observation
Value
Absolute change
Change from the previous value
jan 1, 1992
0.011
+0.011
0.0%
jan 1, 1993
-9.168
-9.18
-80.86K%
jan 1, 1994
-9.043
+0.126
-1.37%
jan 1, 1995
-0.345
+8.697
-96.18%
jan 1, 1996
6.781
+7.126
-2.06K%
jan 1, 1997
10.113
+3.332
49.14%
jan 1, 1998
3.827
-6.287
-62.16%
jan 1, 1999
3.699
-0.128
-3.35%
jan 1, 2000
-1.489
-5.188
-140.26%
jan 1, 2001
4.245
+5.734
-385.11%
jan 1, 2002
2.425
-1.82
-42.88%
jan 1, 2003
3.691
+1.267
52.24%
jan 1, 2004
11.711
+8.02
217.26%
jan 1, 2005
12.268
+0.557
4.75%
jan 1, 2006
14.503
+2.235
18.22%
jan 1, 2007
16.774
+2.271
15.66%
jan 1, 2008
16.4
-0.373
-2.23%
jan 1, 2009
21.555
+5.155
31.43%
jan 1, 2010
21.157
-0.399
-1.85%
jan 1, 2011
27.354
+6.197
29.29%
jan 1, 2012
31.108
+3.754
13.72%
jan 1, 2013
34.474
+3.367
10.82%

Ranking of countries by current statistics by years