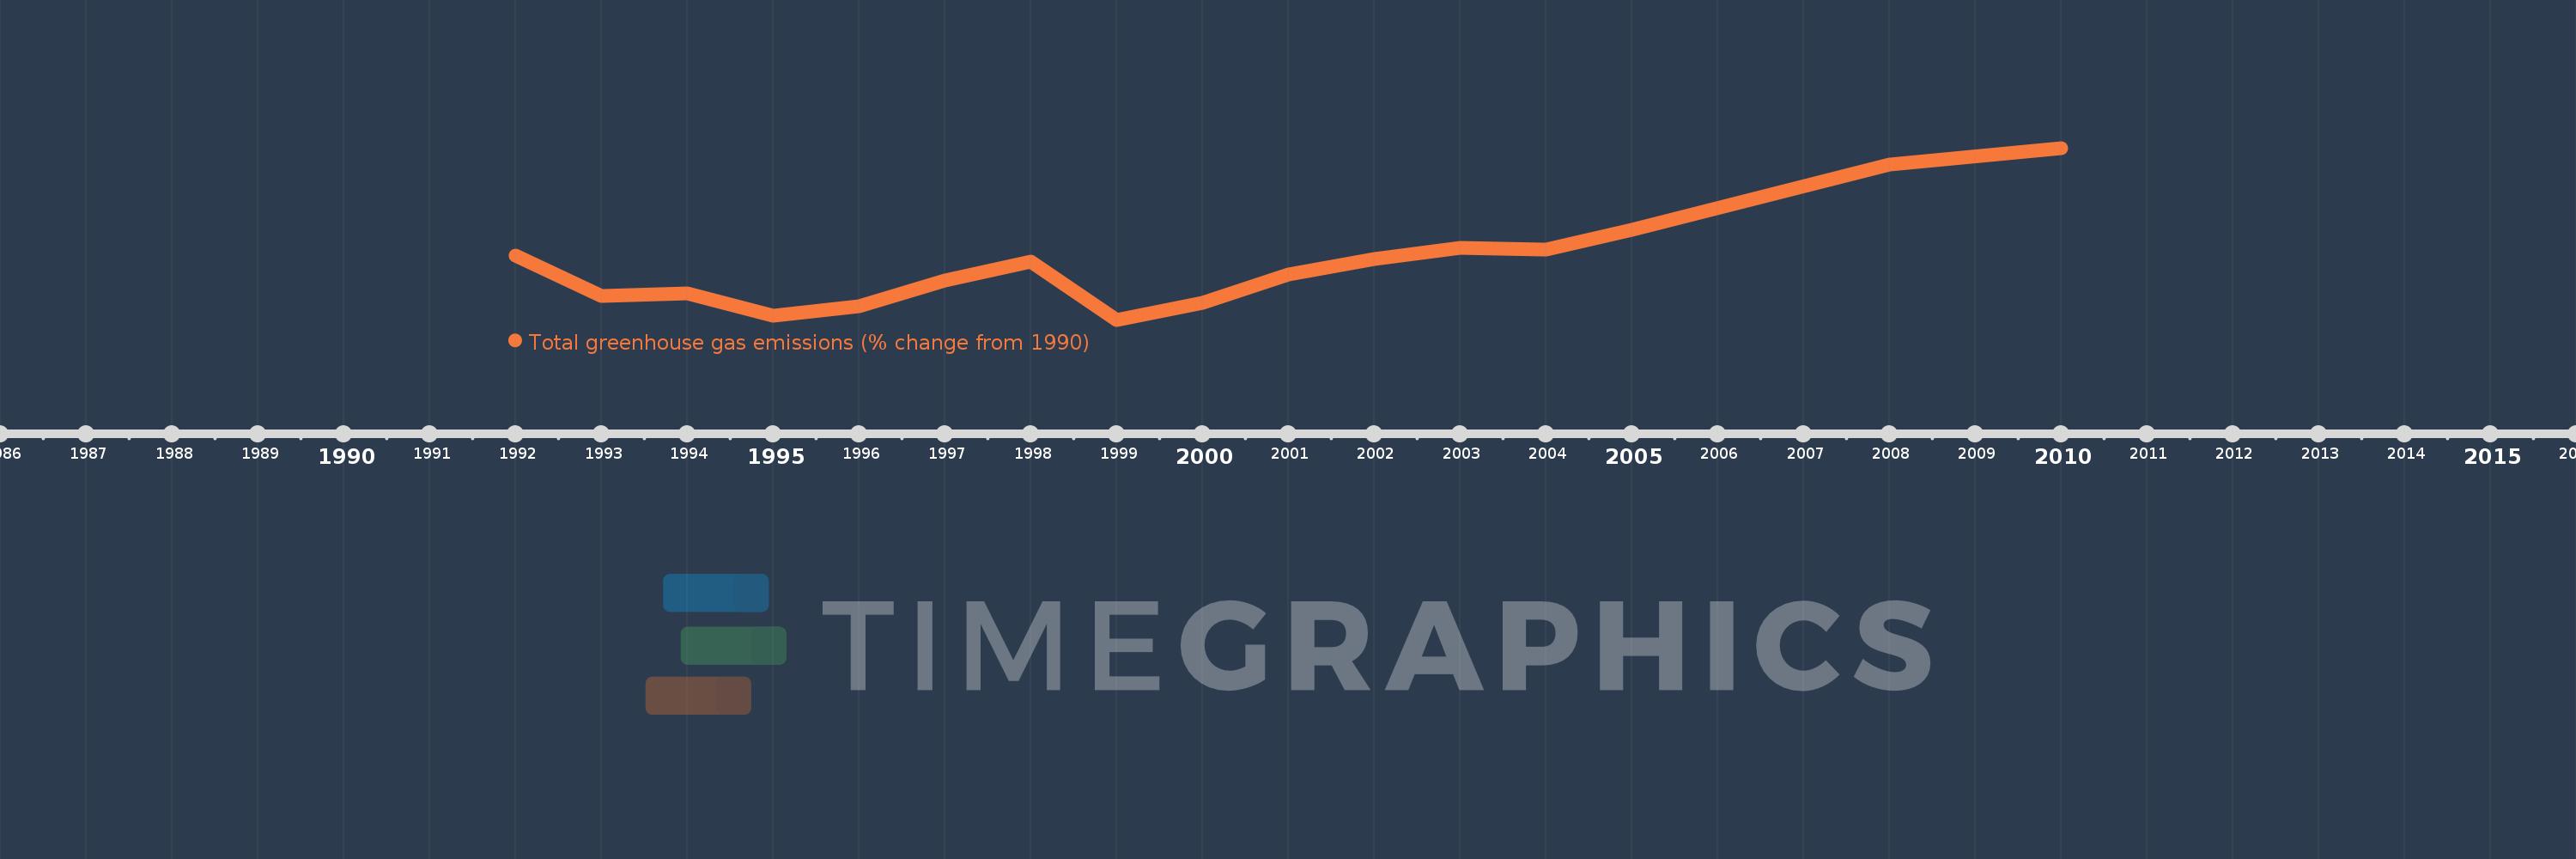
This timeline shows a graph from 1992 to 2010 of Kiribati. No data until 1991. Number of actual observations by date: 16.
Source name:
World Development Indicators
Source organization:
World Bank staff estimates from original source: European Commission, Joint Research Centre (JRC)/Netherlands Environmental Assessment Agency (PBL). Emission Database for Global Atmospheric Research (EDGAR): http://edgar.jrc.ec.europa.eu/.
Categories, topics:
Climate Change, Environment
Last updated:
apr 23, 2017
Indicators value changes by year
Meaning:
9.639
Minimum:
-1.693
jan 1, 1999
Maximum:
32.477
jan 1, 2010
At the date of observation
Value
Absolute change
Change from the previous value
jan 1, 1992
11.127
+11.127
0.0%
jan 1, 1993
2.964
-8.163
-73.36%
jan 1, 1994
3.629
+0.665
22.43%
jan 1, 1995
-0.864
-4.493
-123.81%
jan 1, 1996
0.953
+1.817
-210.36%
jan 1, 1997
6.16
+5.206
546.08%
jan 1, 1998
9.893
+3.733
60.6%
jan 1, 1999
-1.693
-11.586
-117.12%
jan 1, 2000
1.618
+3.311
-195.55%
jan 1, 2001
7.338
+5.72
353.52%
jan 1, 2002
10.44
+3.102
42.28%
jan 1, 2003
12.604
+2.164
20.73%
jan 1, 2004
12.205
-0.399
-3.17%
jan 1, 2005
16.216
+4.011
32.86%
jan 1, 2008
29.15
+12.934
79.76%
jan 1, 2010
32.477
+3.327
11.41%
Ranking of countries by current statistics by years
