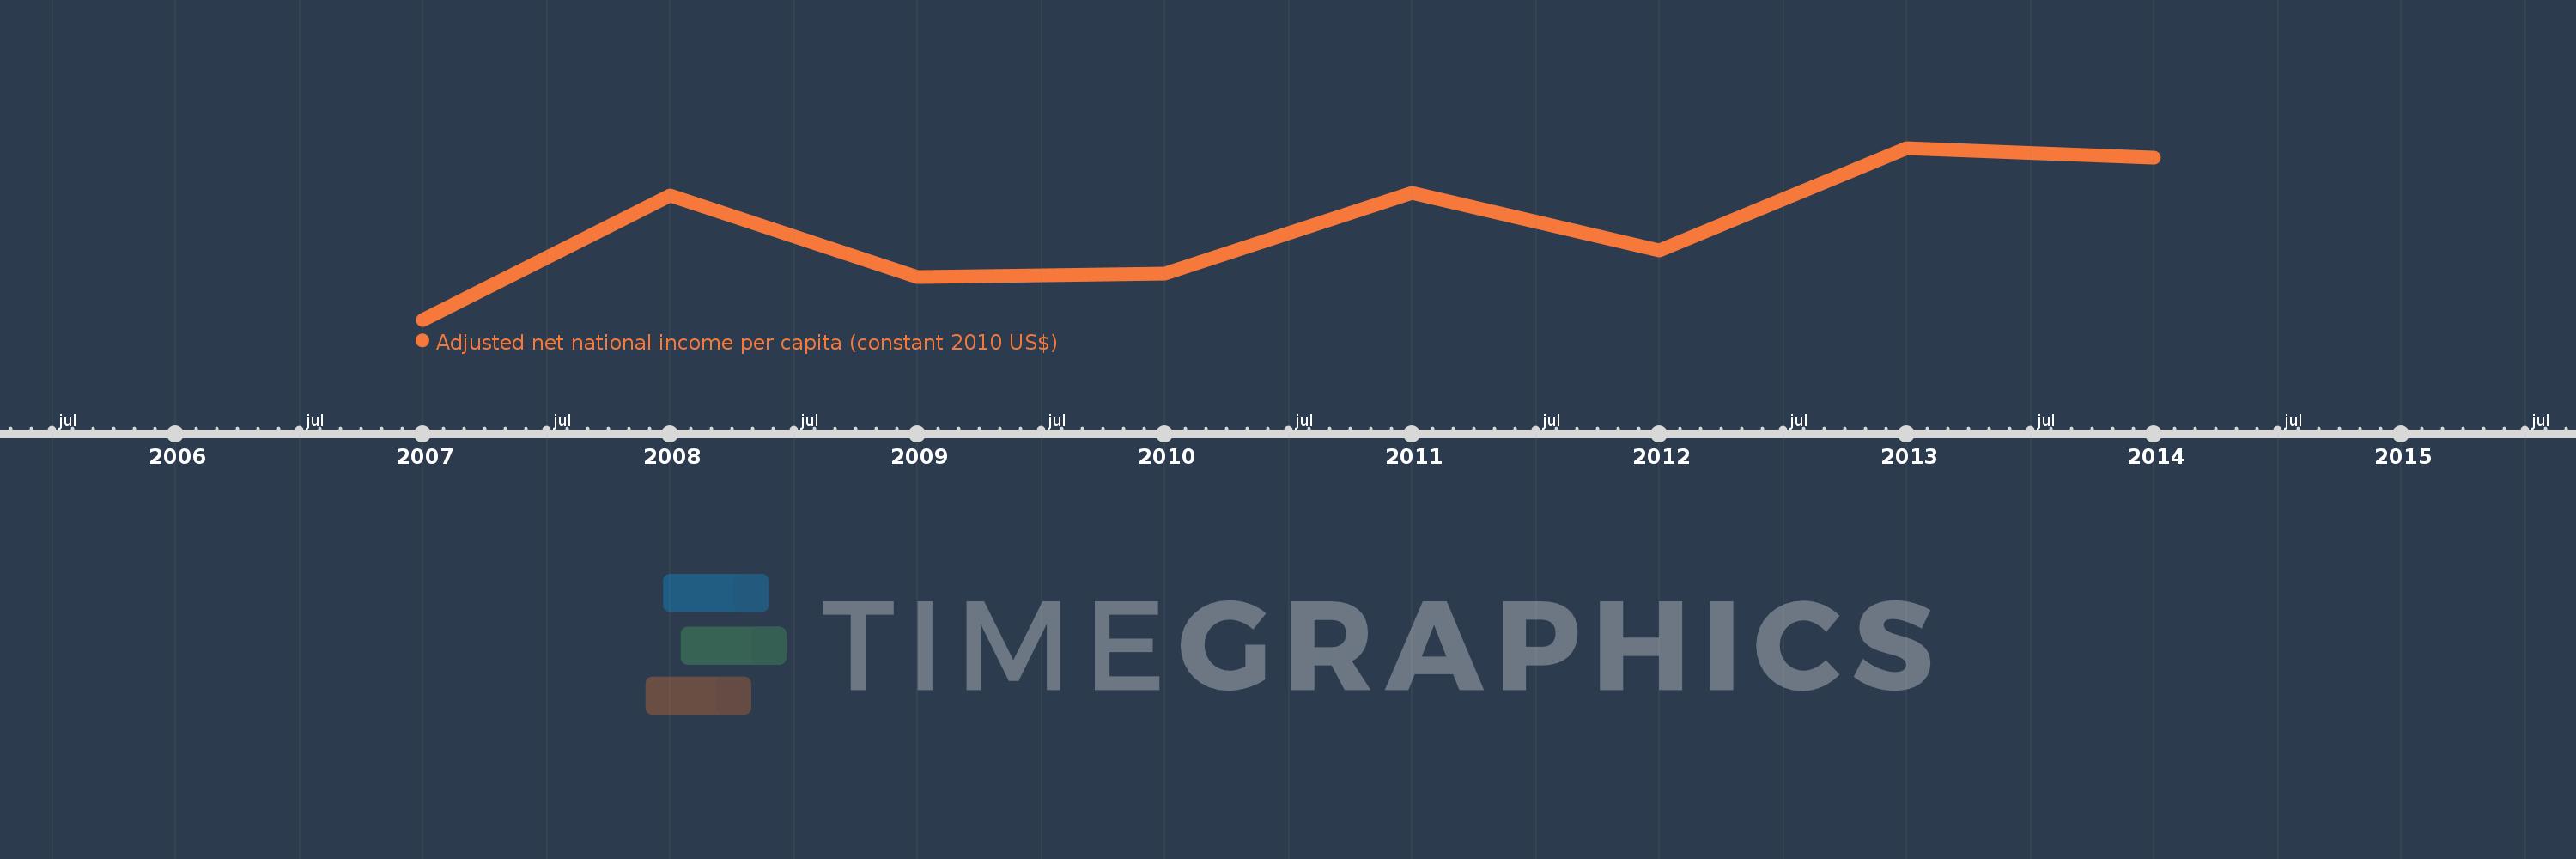
This timeline shows a graph from 2007 to 2014 of Bahrain. No data until 2006. Number of actual observations by date: 8.
Source name:
World Development Indicators
Source organization:
NULWorld Bank staff estimates based on sources and methods in World Bank's "The Changing Wealth of Nations: Measuring Sustainable Development in the New Millennium" (2011).L
Categories, topics:
Economy & Growth
Last updated:
apr 23, 2017
Indicators value changes by year
Meaning:
12.505K
Minimum:
11.617K
jan 1, 2007
Maximum:
13.261K
jan 1, 2013
At the date of observation
Value
Absolute change
Change from the previous value
jan 1, 2007
11.617K
+11.617K
0.0%
jan 1, 2008
12.803K
+1.187K
10.21%
jan 1, 2009
12.023K
-780.129
-6.09%
jan 1, 2010
12.06K
+36.811
0.31%
jan 1, 2011
12.83K
+769.397
6.38%
jan 1, 2012
12.279K
-550.41
-4.29%
jan 1, 2013
13.261K
+981.365
7.99%
jan 1, 2014
13.168K
-92.656
-0.7%
Ranking of countries by current statistics by years
