29
/
en
AIzaSyAYiBZKx7MnpbEhh9jyipgxe19OcubqV5w
April 1, 2024
202491
Mozambique
MOZ
true
2
1
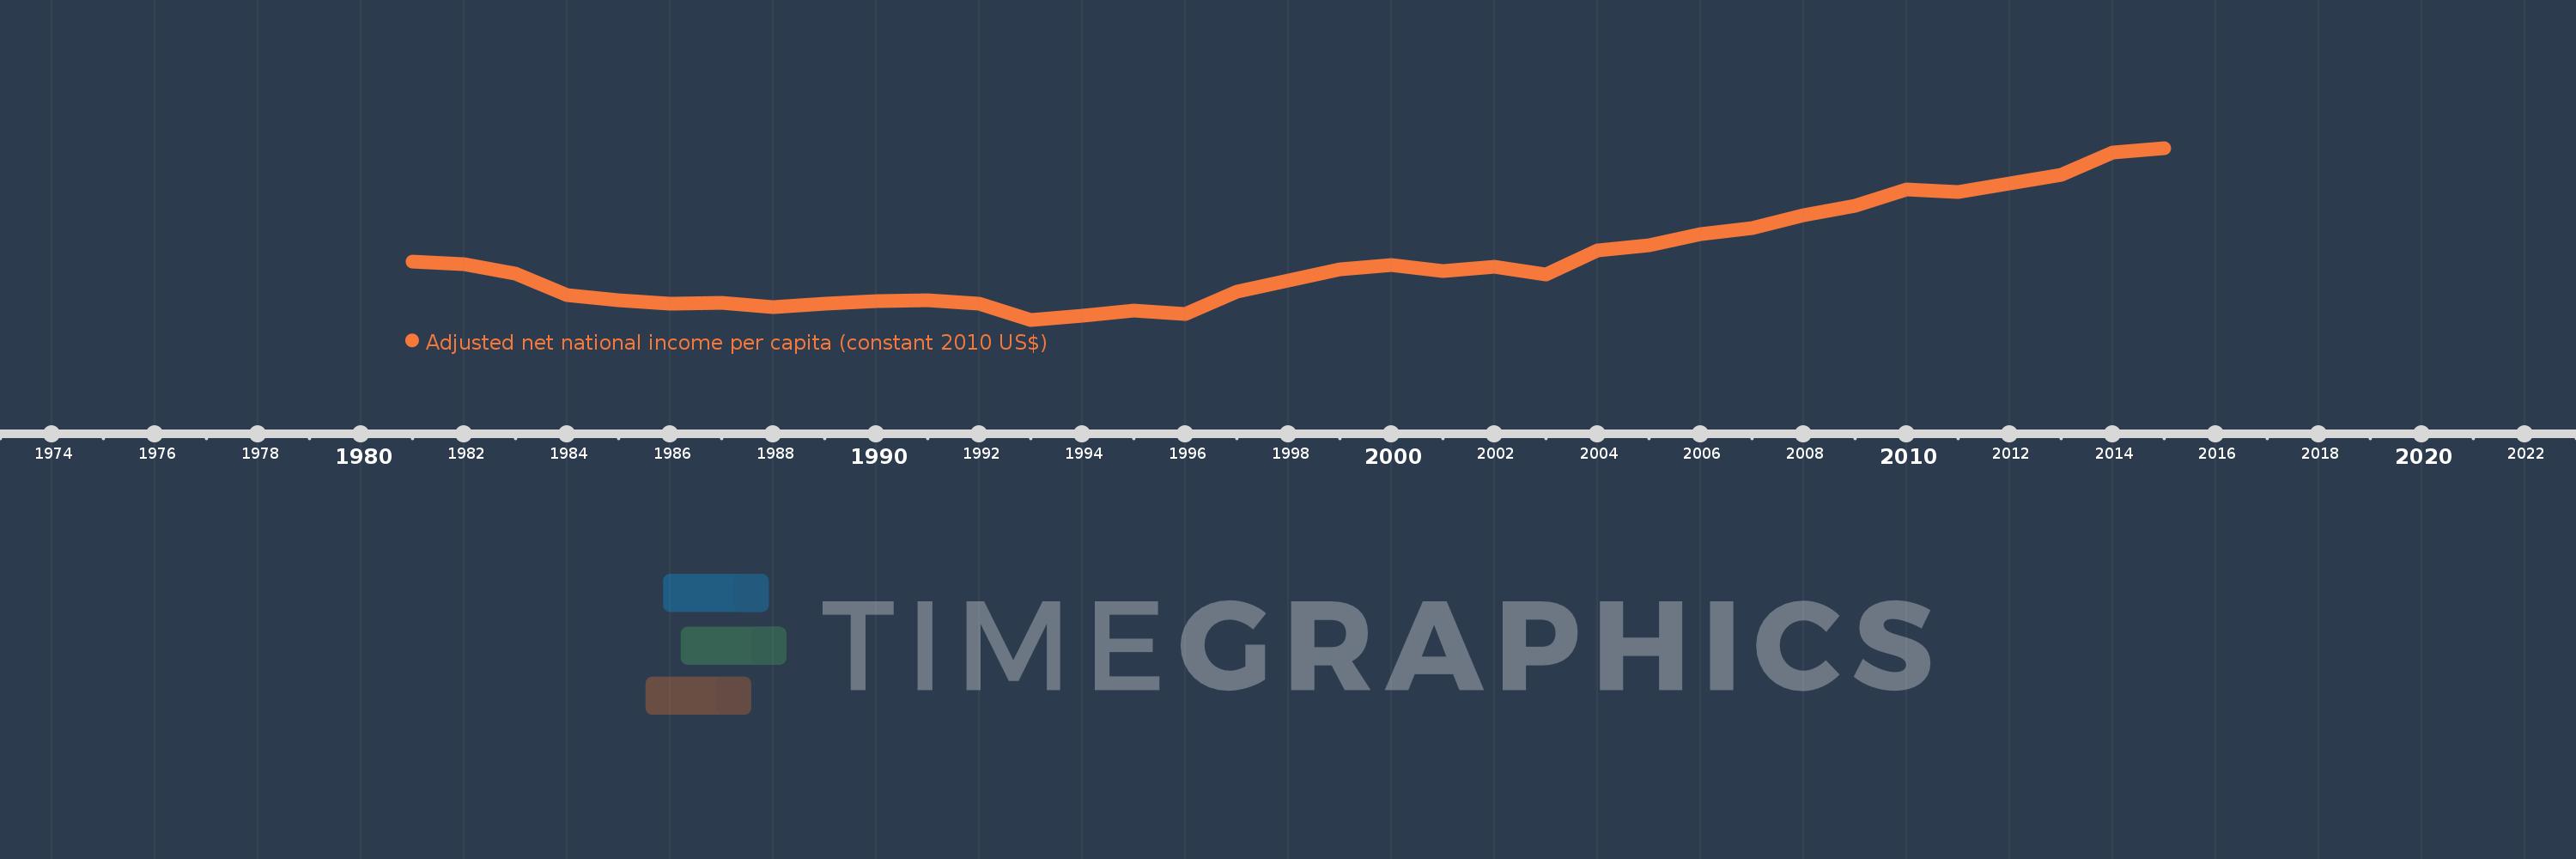
Adjusted net national income per capita (constant 2010 US$)
2015,2014,2013,2012,2011,2010,2009,2008,2007,2006,2005,2004,2003,2002,2001,2000,1999,1998,1997,1996,1995,1994,1993,1992,1991,1990,1989,1988,1987,1986,1985,1984,1983,1982,1981
This statistics in other country:
AfghanistanAlbaniaAlgeriaAngolaArab WorldArgentinaArmeniaAustraliaAustriaAzerbaijanBahamas, TheBahrainBangladeshBarbadosBelarusBelgiumBelizeBeninBhutanBoliviaBotswanaBrazilBulgariaBurkina FasoBurundiCabo VerdeCambodiaCameroonCanadaCaribbean small statesCentral African RepublicCentral Europe and the BalticsChadChileChinaColombiaComorosCongo, Dem. Rep.Congo, Rep.Costa RicaCote d'IvoireCroatiaCubaCyprusCzech RepublicDenmarkDominicaDominican RepublicEarly-demographic dividendEast Asia & PacificEast Asia & Pacific (excluding high income)East Asia & Pacific (IDA & IBRD countries)EcuadorEgypt, Arab Rep.El SalvadorEritreaEstoniaEthiopiaEuro areaEurope & Central AsiaEurope & Central Asia (excluding high income)Europe & Central Asia (IDA & IBRD countries)European UnionFijiFinlandFragile and conflict affected situationsFranceGabonGambia, TheGeorgiaGermanyGhanaGreeceGuatemalaGuineaGuinea-BissauGuyanaHaitiHeavily indebted poor countries (HIPC)High incomeHondurasHungaryIBRD onlyIDA & IBRD totalIDA blendIDA onlyIDA totalIndiaIndonesiaIran, Islamic Rep.IraqIrelandIsraelItalyJamaicaJapanJordanKazakhstanKenyaKiribatiKorea, Rep.KuwaitKyrgyz RepublicLao PDRLate-demographic dividendLatin America & Caribbean Latin America & Caribbean (excluding high income)Latin America & the Caribbean (IDA & IBRD countries)LatviaLeast developed countries: UN classificationLebanonLesothoLiberiaLibyaLithuaniaLow & middle incomeLow incomeLower middle incomeLuxembourgMacedonia, FYRMadagascarMalawiMalaysiaMaldivesMaliMauritaniaMauritiusMexicoMiddle East & North AfricaMiddle East & North Africa (excluding high income)Middle East & North Africa (IDA & IBRD countries)Middle incomeMoldovaMongoliaMoroccoMozambiqueNamibiaNepalNetherlandsNew ZealandNicaraguaNigerNigeriaNorth AmericaNorwayOECD membersOmanOther small statesPacific island small statesPakistanPanamaPapua New GuineaParaguayPeruPhilippinesPolandPortugalPost-demographic dividendPre-demographic dividendQatarRomaniaRussian FederationRwandaSamoaSao Tome and PrincipeSaudi ArabiaSenegalSeychellesSierra LeoneSingaporeSlovak RepublicSloveniaSmall statesSolomon IslandsSouth AfricaSouth AsiaSouth Asia (IDA & IBRD)SpainSri LankaSt. LuciaSt. Vincent and the GrenadinesSub-Saharan Africa Sub-Saharan Africa (excluding high income)Sub-Saharan Africa (IDA & IBRD countries)SurinameSwazilandSwedenSwitzerlandTajikistanTanzaniaThailandTogoTongaTrinidad and TobagoTunisiaTurkeyTurkmenistanUgandaUkraineUnited Arab EmiratesUnited KingdomUnited StatesUpper middle incomeUruguayUzbekistanVanuatuVenezuela, RBVietnamWorldYemen, Rep.ZambiaZimbabwe Timeline:
This timeline shows a graph from 1981 to 2015 of Mozambique. No data until 1980. Number of actual observations by date: 35.
Source name:
World Development Indicators
Source organization:
NULWorld Bank staff estimates based on sources and methods in World Bank's "The Changing Wealth of Nations: Measuring Sustainable Development in the New Millennium" (2011).L
Categories, topics:
Economy & Growth
Last updated:
apr 23, 2017
Indicators value changes by year
Minimum:
125.553
jan 1, 1993
Maximum:
430.362
jan 1, 2015
At the date of observation
Value
Absolute change
Change from previous value
jan 1, 1981
228.604
+228.604
0.0%
jan 1, 1982
224.788
-3.817
-1.67%
jan 1, 1983
207.827
-16.961
-7.55%
jan 1, 1984
169.797
-38.03
-18.3%
jan 1, 1985
159.992
-9.805
-5.77%
jan 1, 1986
154.183
-5.809
-3.63%
jan 1, 1987
155.764
+1.581
1.03%
jan 1, 1988
148.693
-7.072
-4.54%
jan 1, 1989
153.292
+4.599
3.09%
jan 1, 1990
159.264
+5.972
3.9%
jan 1, 1991
160.49
+1.226
0.77%
jan 1, 1992
154.235
-6.255
-3.9%
jan 1, 1993
125.553
-28.682
-18.6%
jan 1, 1994
132.803
+7.249
5.77%
jan 1, 1995
141.882
+9.079
6.84%
jan 1, 1996
135.91
-5.971
-4.21%
jan 1, 1997
176.141
+40.231
29.6%
jan 1, 1998
195.018
+18.877
10.72%
jan 1, 1999
214.312
+19.294
9.89%
jan 1, 2000
222.966
+8.654
4.04%
jan 1, 2001
211.269
-11.697
-5.25%
jan 1, 2002
220.101
+8.832
4.18%
jan 1, 2003
206.076
-14.025
-6.37%
jan 1, 2004
249.234
+43.158
20.94%
jan 1, 2005
258.003
+8.769
3.52%
jan 1, 2006
277.499
+19.496
7.56%
jan 1, 2007
288.509
+11.009
3.97%
jan 1, 2008
311.432
+22.924
7.95%
jan 1, 2009
327.415
+15.982
5.13%
jan 1, 2010
356.833
+29.418
8.99%
jan 1, 2011
352.133
-4.7
-1.32%
jan 1, 2012
367.826
+15.693
4.46%
jan 1, 2013
383.053
+15.227
4.14%
jan 1, 2014
422.914
+39.861
10.41%
jan 1, 2015
430.362
+7.448
1.76%
Ranking of countries by current statistics by years


Comments: