29
/
en
AIzaSyAYiBZKx7MnpbEhh9jyipgxe19OcubqV5w
April 1, 2024
118595
Denmark
DNK
true
2
1
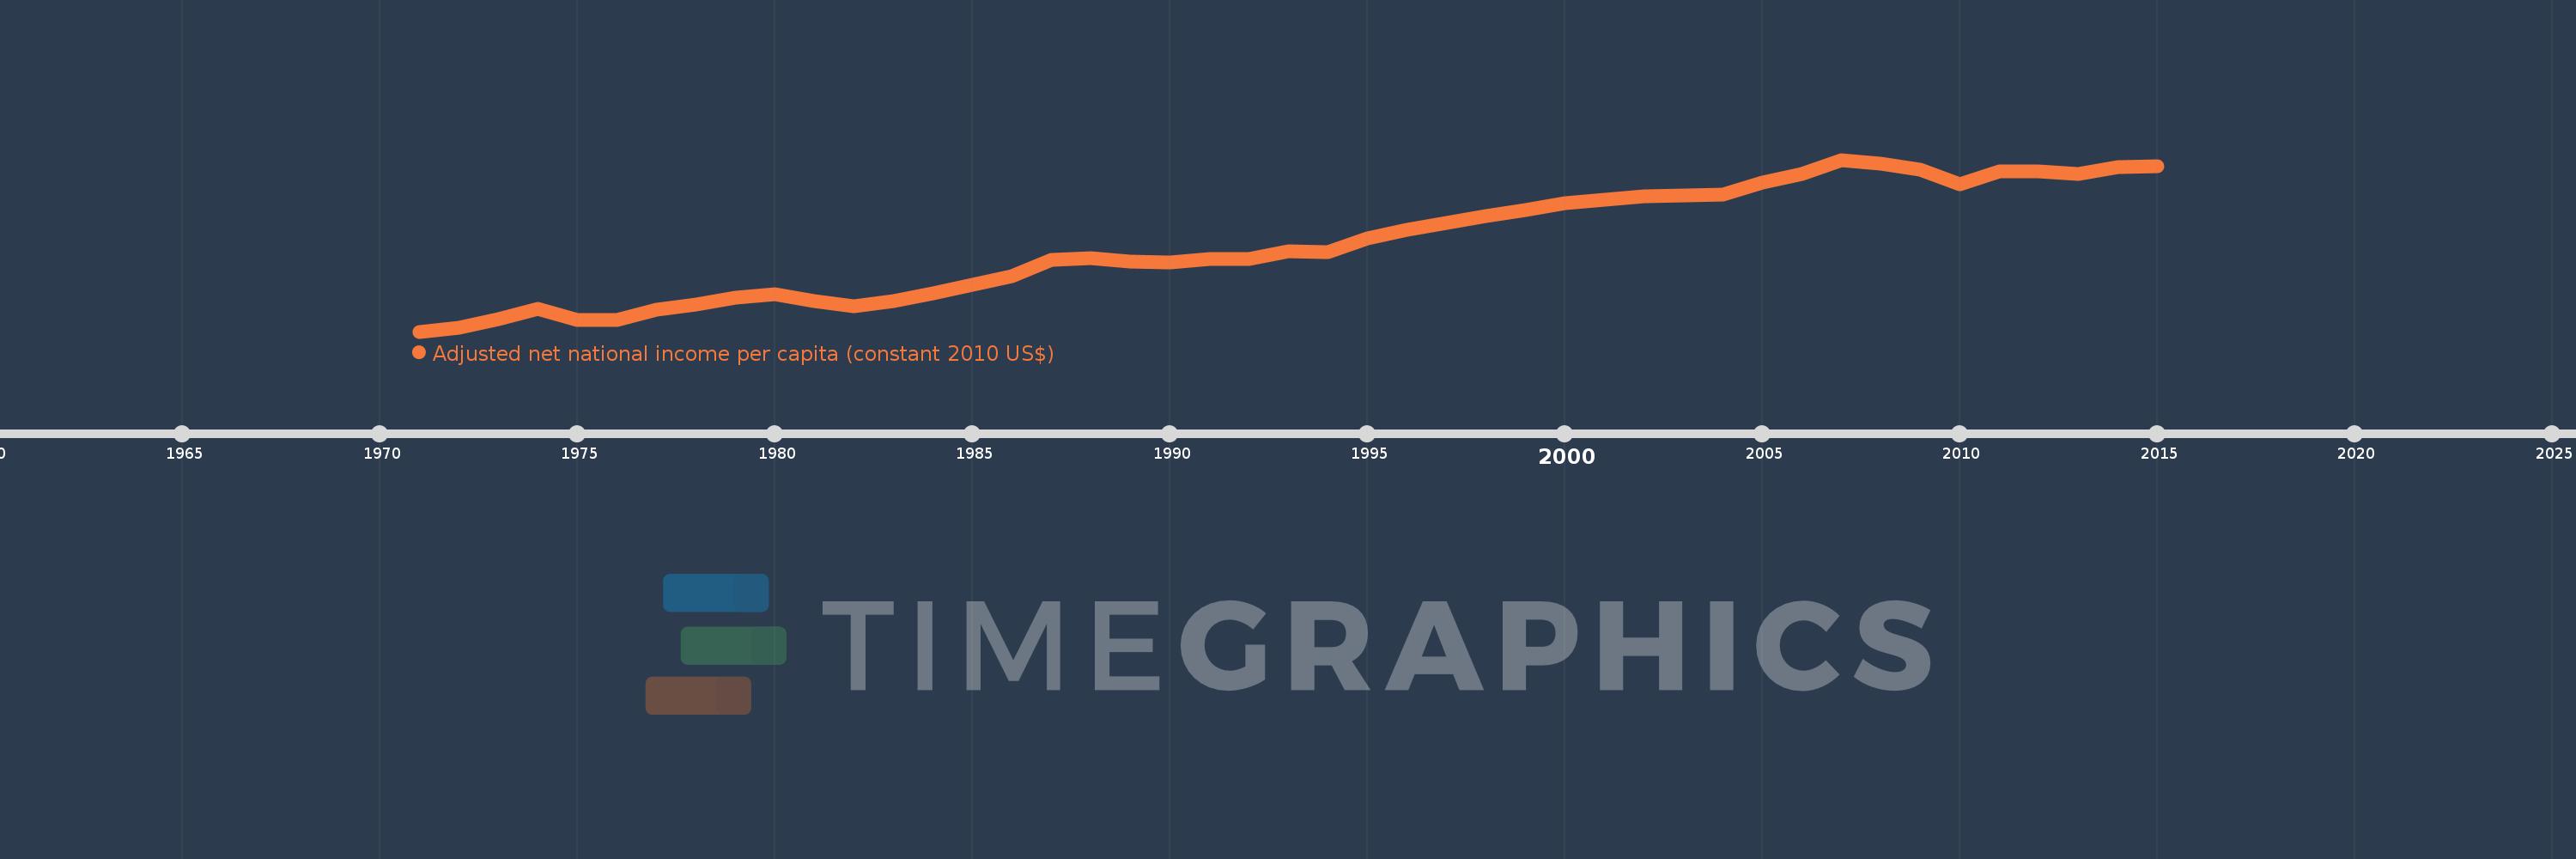
Adjusted net national income per capita (constant 2010 US$)
2015,2014,2013,2012,2011,2010,2009,2008,2007,2006,2005,2004,2003,2002,2001,2000,1999,1998,1997,1996,1995,1994,1993,1992,1991,1990,1989,1988,1987,1986,1985,1984,1983,1982,1981,1980,1979,1978,1977,1976,1975,1974,1973,1972,1971
This statistics in other country:
AfghanistanAlbaniaAlgeriaAngolaArab WorldArgentinaArmeniaAustraliaAustriaAzerbaijanBahamas, TheBahrainBangladeshBarbadosBelarusBelgiumBelizeBeninBhutanBoliviaBotswanaBrazilBulgariaBurkina FasoBurundiCabo VerdeCambodiaCameroonCanadaCaribbean small statesCentral African RepublicCentral Europe and the BalticsChadChileChinaColombiaComorosCongo, Dem. Rep.Congo, Rep.Costa RicaCote d'IvoireCroatiaCubaCyprusCzech RepublicDenmarkDominicaDominican RepublicEarly-demographic dividendEast Asia & PacificEast Asia & Pacific (excluding high income)East Asia & Pacific (IDA & IBRD countries)EcuadorEgypt, Arab Rep.El SalvadorEritreaEstoniaEthiopiaEuro areaEurope & Central AsiaEurope & Central Asia (excluding high income)Europe & Central Asia (IDA & IBRD countries)European UnionFijiFinlandFragile and conflict affected situationsFranceGabonGambia, TheGeorgiaGermanyGhanaGreeceGuatemalaGuineaGuinea-BissauGuyanaHaitiHeavily indebted poor countries (HIPC)High incomeHondurasHungaryIBRD onlyIDA & IBRD totalIDA blendIDA onlyIDA totalIndiaIndonesiaIran, Islamic Rep.IraqIrelandIsraelItalyJamaicaJapanJordanKazakhstanKenyaKiribatiKorea, Rep.KuwaitKyrgyz RepublicLao PDRLate-demographic dividendLatin America & Caribbean Latin America & Caribbean (excluding high income)Latin America & the Caribbean (IDA & IBRD countries)LatviaLeast developed countries: UN classificationLebanonLesothoLiberiaLibyaLithuaniaLow & middle incomeLow incomeLower middle incomeLuxembourgMacedonia, FYRMadagascarMalawiMalaysiaMaldivesMaliMauritaniaMauritiusMexicoMiddle East & North AfricaMiddle East & North Africa (excluding high income)Middle East & North Africa (IDA & IBRD countries)Middle incomeMoldovaMongoliaMoroccoMozambiqueNamibiaNepalNetherlandsNew ZealandNicaraguaNigerNigeriaNorth AmericaNorwayOECD membersOmanOther small statesPacific island small statesPakistanPanamaPapua New GuineaParaguayPeruPhilippinesPolandPortugalPost-demographic dividendPre-demographic dividendQatarRomaniaRussian FederationRwandaSamoaSao Tome and PrincipeSaudi ArabiaSenegalSeychellesSierra LeoneSingaporeSlovak RepublicSloveniaSmall statesSolomon IslandsSouth AfricaSouth AsiaSouth Asia (IDA & IBRD)SpainSri LankaSt. LuciaSt. Vincent and the GrenadinesSub-Saharan Africa Sub-Saharan Africa (excluding high income)Sub-Saharan Africa (IDA & IBRD countries)SurinameSwazilandSwedenSwitzerlandTajikistanTanzaniaThailandTogoTongaTrinidad and TobagoTunisiaTurkeyTurkmenistanUgandaUkraineUnited Arab EmiratesUnited KingdomUnited StatesUpper middle incomeUruguayUzbekistanVanuatuVenezuela, RBVietnamWorldYemen, Rep.ZambiaZimbabwe Timeline:
This timeline shows a graph from 1971 to 2015 of Denmark. No data until 1970. Number of actual observations by date: 45.
Source name:
World Development Indicators
Source organization:
NULWorld Bank staff estimates based on sources and methods in World Bank's "The Changing Wealth of Nations: Measuring Sustainable Development in the New Millennium" (2011).L
Categories, topics:
Economy & Growth
Last updated:
apr 23, 2017
Indicators value changes by year
Minimum:
25.403K
jan 1, 1971
Maximum:
49.002K
jan 1, 2007
At the date of observation
Value
Absolute change
Change from previous value
jan 1, 1971
25.403K
+25.403K
0.0%
jan 1, 1972
25.932K
+528.821
2.08%
jan 1, 1973
27.074K
+1.143K
4.41%
jan 1, 1974
28.501K
+1.427K
5.27%
jan 1, 1975
27.043K
-1.458K
-5.12%
jan 1, 1976
27.011K
-31.799
-0.12%
jan 1, 1977
28.44K
+1.429K
5.29%
jan 1, 1978
29.083K
+642.507
2.26%
jan 1, 1979
30.107K
+1.024K
3.52%
jan 1, 1980
30.554K
+447.56
1.49%
jan 1, 1981
29.609K
-945.734
-3.1%
jan 1, 1982
28.85K
-758.184
-2.56%
jan 1, 1983
29.611K
+760.615
2.64%
jan 1, 1984
30.665K
+1.054K
3.56%
jan 1, 1985
31.85K
+1.184K
3.86%
jan 1, 1986
33.002K
+1.152K
3.62%
jan 1, 1987
35.216K
+2.214K
6.71%
jan 1, 1988
35.477K
+260.955
0.74%
jan 1, 1989
35.075K
-402.125
-1.13%
jan 1, 1990
34.939K
-136.159
-0.39%
jan 1, 1991
35.323K
+384.752
1.1%
jan 1, 1992
35.364K
+40.698
0.12%
jan 1, 1993
36.486K
+1.122K
3.17%
jan 1, 1994
36.315K
-170.91
-0.47%
jan 1, 1995
38.197K
+1.882K
5.18%
jan 1, 1996
39.388K
+1.191K
3.12%
jan 1, 1997
40.374K
+985.545
2.5%
jan 1, 1998
41.226K
+851.993
2.11%
jan 1, 1999
42.073K
+847.778
2.06%
jan 1, 2000
43.073K
+999.929
2.38%
jan 1, 2001
43.534K
+460.754
1.07%
jan 1, 2002
44.013K
+479.088
1.1%
jan 1, 2003
44.062K
+48.583
0.11%
jan 1, 2004
44.239K
+176.794
0.4%
jan 1, 2005
45.844K
+1.606K
3.63%
jan 1, 2006
47.097K
+1.253K
2.73%
jan 1, 2007
49.002K
+1.905K
4.05%
jan 1, 2008
48.518K
-483.839
-0.99%
jan 1, 2009
47.604K
-914.229
-1.88%
jan 1, 2010
45.646K
-1.958K
-4.11%
jan 1, 2011
47.356K
+1.71K
3.75%
jan 1, 2012
47.424K
+68.29
0.14%
jan 1, 2013
47.081K
-342.701
-0.72%
jan 1, 2014
47.999K
+917.538
1.95%
jan 1, 2015
48.127K
+128.054
0.27%
Ranking of countries by current statistics by years


Comments: