29
/
en
AIzaSyAYiBZKx7MnpbEhh9jyipgxe19OcubqV5w
April 1, 2024
204894
Namibia
NAM
true
2
1
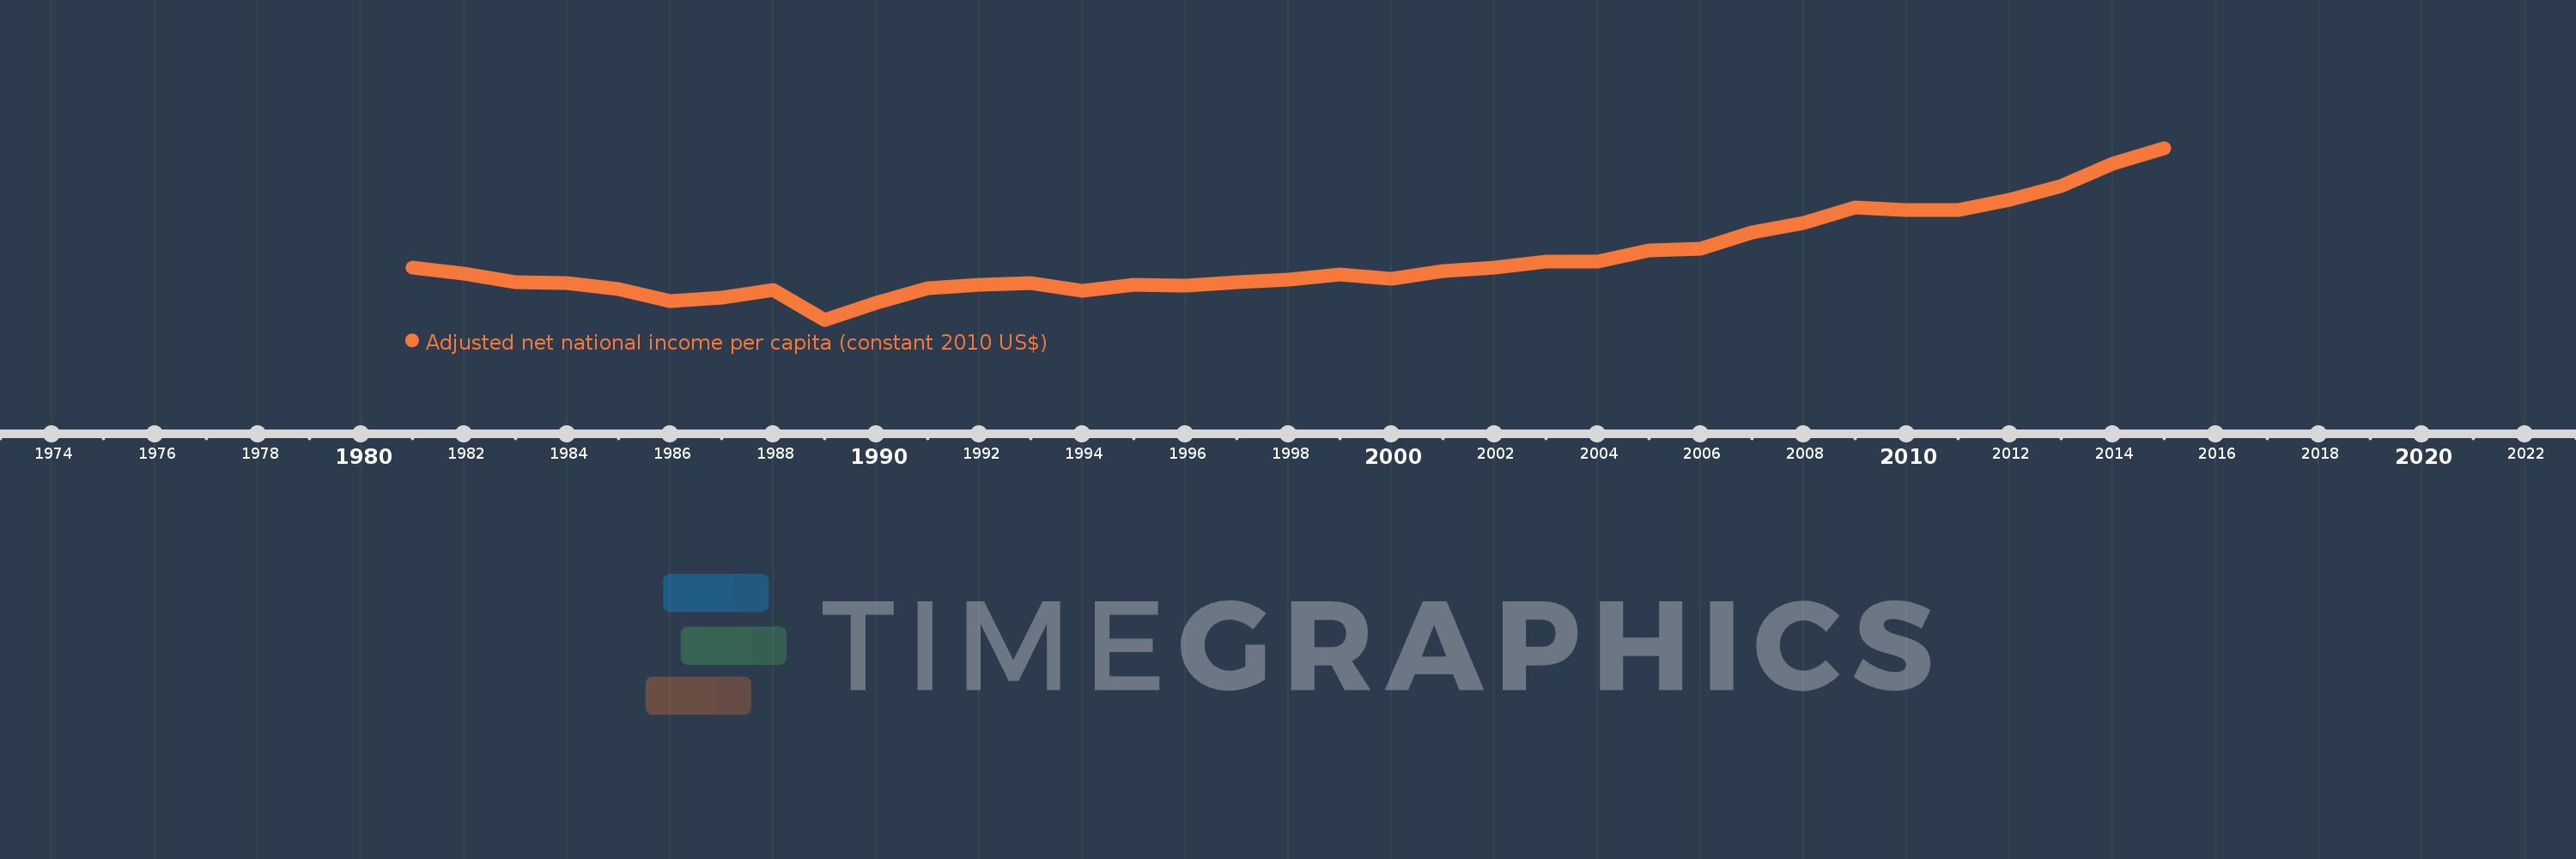
Adjusted net national income per capita (constant 2010 US$)
2015,2014,2013,2012,2011,2010,2009,2008,2007,2006,2005,2004,2003,2002,2001,2000,1999,1998,1997,1996,1995,1994,1993,1992,1991,1990,1989,1988,1987,1986,1985,1984,1983,1982,1981
This statistics in other country:
AfghanistanAlbaniaAlgeriaAngolaArab WorldArgentinaArmeniaAustraliaAustriaAzerbaijanBahamas, TheBahrainBangladeshBarbadosBelarusBelgiumBelizeBeninBhutanBoliviaBotswanaBrazilBulgariaBurkina FasoBurundiCabo VerdeCambodiaCameroonCanadaCaribbean small statesCentral African RepublicCentral Europe and the BalticsChadChileChinaColombiaComorosCongo, Dem. Rep.Congo, Rep.Costa RicaCote d'IvoireCroatiaCubaCyprusCzech RepublicDenmarkDominicaDominican RepublicEarly-demographic dividendEast Asia & PacificEast Asia & Pacific (excluding high income)East Asia & Pacific (IDA & IBRD countries)EcuadorEgypt, Arab Rep.El SalvadorEritreaEstoniaEthiopiaEuro areaEurope & Central AsiaEurope & Central Asia (excluding high income)Europe & Central Asia (IDA & IBRD countries)European UnionFijiFinlandFragile and conflict affected situationsFranceGabonGambia, TheGeorgiaGermanyGhanaGreeceGuatemalaGuineaGuinea-BissauGuyanaHaitiHeavily indebted poor countries (HIPC)High incomeHondurasHungaryIBRD onlyIDA & IBRD totalIDA blendIDA onlyIDA totalIndiaIndonesiaIran, Islamic Rep.IraqIrelandIsraelItalyJamaicaJapanJordanKazakhstanKenyaKiribatiKorea, Rep.KuwaitKyrgyz RepublicLao PDRLate-demographic dividendLatin America & Caribbean Latin America & Caribbean (excluding high income)Latin America & the Caribbean (IDA & IBRD countries)LatviaLeast developed countries: UN classificationLebanonLesothoLiberiaLibyaLithuaniaLow & middle incomeLow incomeLower middle incomeLuxembourgMacedonia, FYRMadagascarMalawiMalaysiaMaldivesMaliMauritaniaMauritiusMexicoMiddle East & North AfricaMiddle East & North Africa (excluding high income)Middle East & North Africa (IDA & IBRD countries)Middle incomeMoldovaMongoliaMoroccoMozambiqueNamibiaNepalNetherlandsNew ZealandNicaraguaNigerNigeriaNorth AmericaNorwayOECD membersOmanOther small statesPacific island small statesPakistanPanamaPapua New GuineaParaguayPeruPhilippinesPolandPortugalPost-demographic dividendPre-demographic dividendQatarRomaniaRussian FederationRwandaSamoaSao Tome and PrincipeSaudi ArabiaSenegalSeychellesSierra LeoneSingaporeSlovak RepublicSloveniaSmall statesSolomon IslandsSouth AfricaSouth AsiaSouth Asia (IDA & IBRD)SpainSri LankaSt. LuciaSt. Vincent and the GrenadinesSub-Saharan Africa Sub-Saharan Africa (excluding high income)Sub-Saharan Africa (IDA & IBRD countries)SurinameSwazilandSwedenSwitzerlandTajikistanTanzaniaThailandTogoTongaTrinidad and TobagoTunisiaTurkeyTurkmenistanUgandaUkraineUnited Arab EmiratesUnited KingdomUnited StatesUpper middle incomeUruguayUzbekistanVanuatuVenezuela, RBVietnamWorldYemen, Rep.ZambiaZimbabwe Timeline:
This timeline shows a graph from 1981 to 2015 of Namibia. No data until 1980. Number of actual observations by date: 35.
Source name:
World Development Indicators
Source organization:
NULWorld Bank staff estimates based on sources and methods in World Bank's "The Changing Wealth of Nations: Measuring Sustainable Development in the New Millennium" (2011).L
Categories, topics:
Economy & Growth
Last updated:
apr 23, 2017
Indicators value changes by year
Minimum:
2.024K
jan 1, 1989
Maximum:
5.672K
jan 1, 2015
At the date of observation
Value
Absolute change
Change from previous value
jan 1, 1981
3.122K
+3.122K
0.0%
jan 1, 1982
2.996K
-126.378
-4.05%
jan 1, 1983
2.822K
-173.822
-5.8%
jan 1, 1984
2.807K
-14.713
-0.52%
jan 1, 1985
2.677K
-130.292
-4.64%
jan 1, 1986
2.421K
-255.735
-9.55%
jan 1, 1987
2.491K
+70.04
2.89%
jan 1, 1988
2.653K
+161.655
6.49%
jan 1, 1989
2.024K
-629.474
-23.73%
jan 1, 1990
2.378K
+354.128
17.5%
jan 1, 1991
2.692K
+314.241
13.22%
jan 1, 1992
2.758K
+66.073
2.45%
jan 1, 1993
2.798K
+39.835
1.44%
jan 1, 1994
2.63K
-168.263
-6.01%
jan 1, 1995
2.771K
+141.767
5.39%
jan 1, 1996
2.746K
-25.008
-0.9%
jan 1, 1997
2.818K
+71.466
2.6%
jan 1, 1998
2.883K
+65.507
2.32%
jan 1, 1999
2.983K
+99.495
3.45%
jan 1, 2000
2.889K
-93.991
-3.15%
jan 1, 2001
3.055K
+166.478
5.76%
jan 1, 2002
3.137K
+81.771
2.68%
jan 1, 2003
3.263K
+126.026
4.02%
jan 1, 2004
3.258K
-5.622
-0.17%
jan 1, 2005
3.488K
+230.89
7.09%
jan 1, 2006
3.526K
+37.716
1.08%
jan 1, 2007
3.876K
+349.363
9.91%
jan 1, 2008
4.072K
+196.764
5.08%
jan 1, 2009
4.41K
+338.117
8.3%
jan 1, 2010
4.35K
-59.923
-1.36%
jan 1, 2011
4.355K
+4.823
0.11%
jan 1, 2012
4.571K
+216.132
4.96%
jan 1, 2013
4.867K
+295.61
6.47%
jan 1, 2014
5.342K
+474.549
9.75%
jan 1, 2015
5.672K
+330.418
6.19%
Ranking of countries by current statistics by years


Comments: