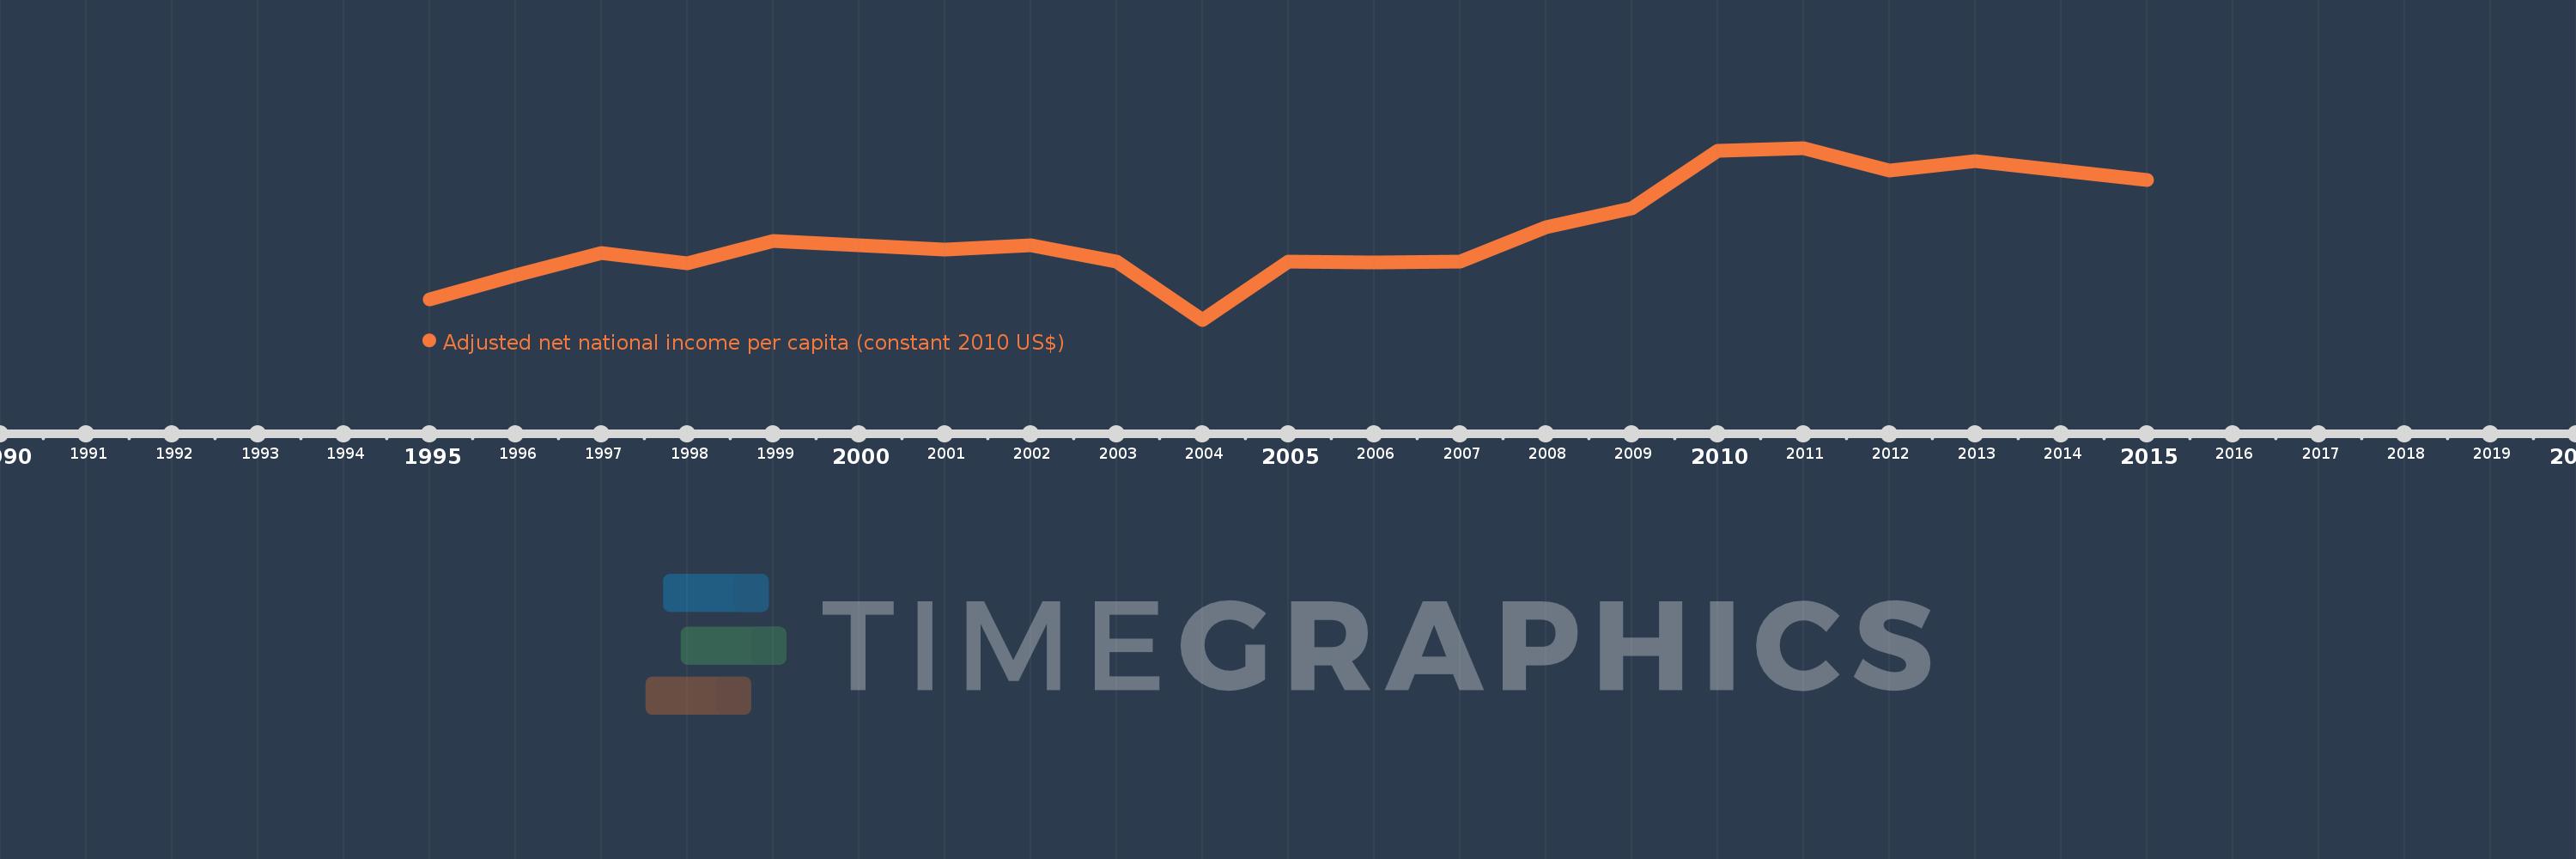
This timeline shows a graph from 1995 to 2015 of Lebanon. No data until 1994. Number of actual observations by date: 21.
Source name:
World Development Indicators
Source organization:
NULWorld Bank staff estimates based on sources and methods in World Bank's "The Changing Wealth of Nations: Measuring Sustainable Development in the New Millennium" (2011).L
Categories, topics:
Economy & Growth
Last updated:
apr 23, 2017
Indicators value changes by year
Meaning:
6.122K
Minimum:
4.62K
jan 1, 2004
Maximum:
7.536K
jan 1, 2011
At the date of observation
Value
Absolute change
Change from the previous value
jan 1, 1995
4.964K
+4.964K
0.0%
jan 1, 1996
5.38K
+415.99
8.38%
jan 1, 1997
5.754K
+373.664
6.95%
jan 1, 1998
5.575K
-178.503
-3.1%
jan 1, 1999
5.952K
+376.464
6.75%
jan 1, 2000
5.88K
-71.471
-1.2%
jan 1, 2001
5.806K
-74.386
-1.27%
jan 1, 2002
5.877K
+70.978
1.22%
jan 1, 2003
5.602K
-274.973
-4.68%
jan 1, 2004
4.62K
-982.1
-17.53%
jan 1, 2005
5.613K
+992.895
21.49%
jan 1, 2006
5.593K
-19.517
-0.35%
jan 1, 2007
5.608K
+14.634
0.26%
jan 1, 2008
6.187K
+579.052
10.33%
jan 1, 2009
6.514K
+327.062
5.29%
jan 1, 2010
7.493K
+979.369
15.04%
jan 1, 2011
7.536K
+42.536
0.57%
jan 1, 2012
7.148K
-388.102
-5.15%
jan 1, 2013
7.315K
+167.675
2.35%
jan 1, 2014
7.147K
-168.144
-2.3%
jan 1, 2015
6.998K
-148.834
-2.08%
Ranking of countries by current statistics by years
