29
/
en
AIzaSyAYiBZKx7MnpbEhh9jyipgxe19OcubqV5w
April 1, 2024
29623
Euro area
EMU
false
2
1
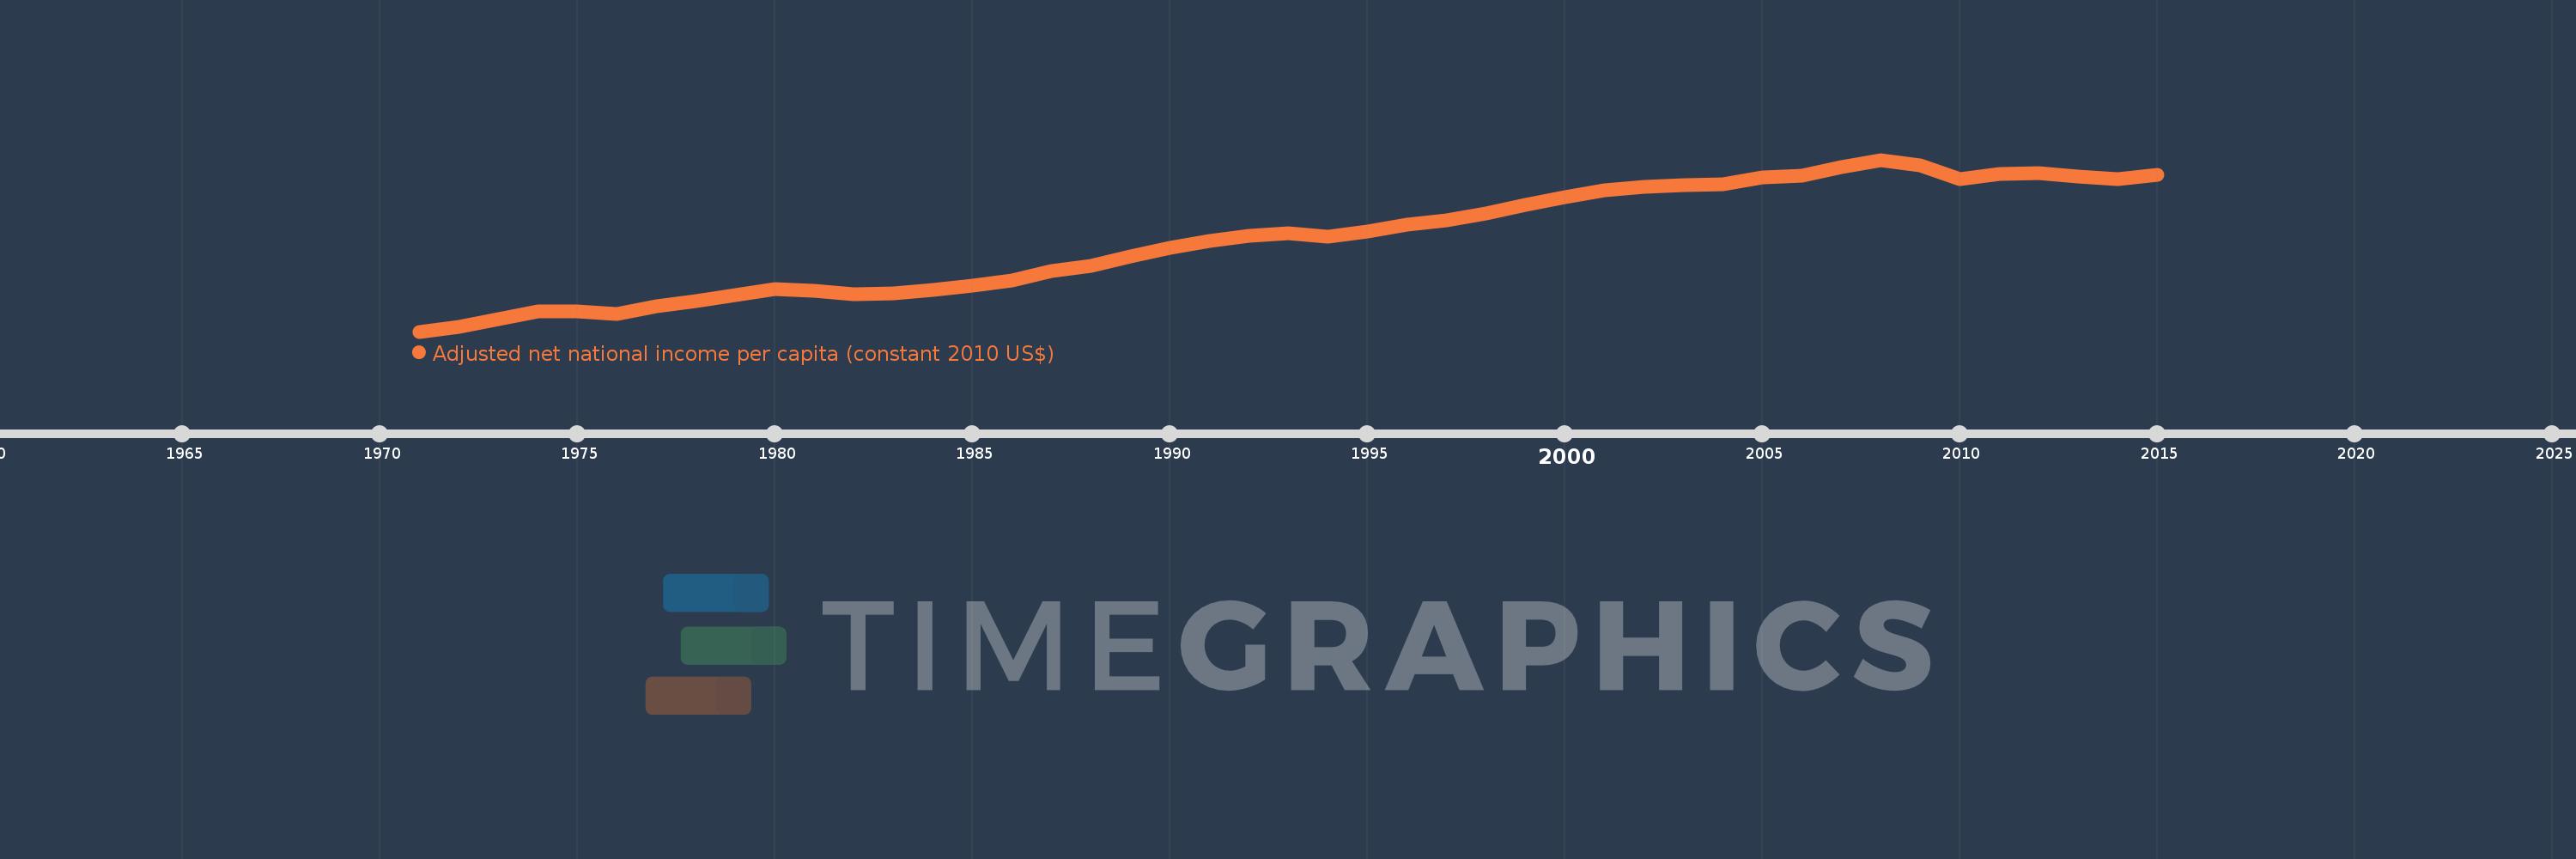
Adjusted net national income per capita (constant 2010 US$)
2015,2014,2013,2012,2011,2010,2009,2008,2007,2006,2005,2004,2003,2002,2001,2000,1999,1998,1997,1996,1995,1994,1993,1992,1991,1990,1989,1988,1987,1986,1985,1984,1983,1982,1981,1980,1979,1978,1977,1976,1975,1974,1973,1972,1971
This statistics in other country:
AfghanistanAlbaniaAlgeriaAngolaArab WorldArgentinaArmeniaAustraliaAustriaAzerbaijanBahamas, TheBahrainBangladeshBarbadosBelarusBelgiumBelizeBeninBhutanBoliviaBotswanaBrazilBulgariaBurkina FasoBurundiCabo VerdeCambodiaCameroonCanadaCaribbean small statesCentral African RepublicCentral Europe and the BalticsChadChileChinaColombiaComorosCongo, Dem. Rep.Congo, Rep.Costa RicaCote d'IvoireCroatiaCubaCyprusCzech RepublicDenmarkDominicaDominican RepublicEarly-demographic dividendEast Asia & PacificEast Asia & Pacific (excluding high income)East Asia & Pacific (IDA & IBRD countries)EcuadorEgypt, Arab Rep.El SalvadorEritreaEstoniaEthiopiaEuro areaEurope & Central AsiaEurope & Central Asia (excluding high income)Europe & Central Asia (IDA & IBRD countries)European UnionFijiFinlandFragile and conflict affected situationsFranceGabonGambia, TheGeorgiaGermanyGhanaGreeceGuatemalaGuineaGuinea-BissauGuyanaHaitiHeavily indebted poor countries (HIPC)High incomeHondurasHungaryIBRD onlyIDA & IBRD totalIDA blendIDA onlyIDA totalIndiaIndonesiaIran, Islamic Rep.IraqIrelandIsraelItalyJamaicaJapanJordanKazakhstanKenyaKiribatiKorea, Rep.KuwaitKyrgyz RepublicLao PDRLate-demographic dividendLatin America & Caribbean Latin America & Caribbean (excluding high income)Latin America & the Caribbean (IDA & IBRD countries)LatviaLeast developed countries: UN classificationLebanonLesothoLiberiaLibyaLithuaniaLow & middle incomeLow incomeLower middle incomeLuxembourgMacedonia, FYRMadagascarMalawiMalaysiaMaldivesMaliMauritaniaMauritiusMexicoMiddle East & North AfricaMiddle East & North Africa (excluding high income)Middle East & North Africa (IDA & IBRD countries)Middle incomeMoldovaMongoliaMoroccoMozambiqueNamibiaNepalNetherlandsNew ZealandNicaraguaNigerNigeriaNorth AmericaNorwayOECD membersOmanOther small statesPacific island small statesPakistanPanamaPapua New GuineaParaguayPeruPhilippinesPolandPortugalPost-demographic dividendPre-demographic dividendQatarRomaniaRussian FederationRwandaSamoaSao Tome and PrincipeSaudi ArabiaSenegalSeychellesSierra LeoneSingaporeSlovak RepublicSloveniaSmall statesSolomon IslandsSouth AfricaSouth AsiaSouth Asia (IDA & IBRD)SpainSri LankaSt. LuciaSt. Vincent and the GrenadinesSub-Saharan Africa Sub-Saharan Africa (excluding high income)Sub-Saharan Africa (IDA & IBRD countries)SurinameSwazilandSwedenSwitzerlandTajikistanTanzaniaThailandTogoTongaTrinidad and TobagoTunisiaTurkeyTurkmenistanUgandaUkraineUnited Arab EmiratesUnited KingdomUnited StatesUpper middle incomeUruguayUzbekistanVanuatuVenezuela, RBVietnamWorldYemen, Rep.ZambiaZimbabwe Timeline:
This timeline shows a graph from 1971 to 2015 of Euro area. No data until 1970. Number of actual observations by date: 45.
Source name:
World Development Indicators
Source organization:
NULWorld Bank staff estimates based on sources and methods in World Bank's "The Changing Wealth of Nations: Measuring Sustainable Development in the New Millennium" (2011).L
Categories, topics:
Economy & Growth
Last updated:
apr 23, 2017
Indicators value changes by year
Minimum:
15.538K
jan 1, 1971
Maximum:
32.567K
jan 1, 2008
At the date of observation
Value
Absolute change
Change from previous value
jan 1, 1971
15.538K
+15.538K
0.0%
jan 1, 1972
16.033K
+495.127
3.19%
jan 1, 1973
16.733K
+700.228
4.37%
jan 1, 1974
17.571K
+837.386
5.0%
jan 1, 1975
17.498K
-72.181
-0.41%
jan 1, 1976
17.306K
-192.504
-1.1%
jan 1, 1977
18.018K
+712.501
4.12%
jan 1, 1978
18.524K
+506.087
2.81%
jan 1, 1979
19.186K
+661.563
3.57%
jan 1, 1980
19.713K
+526.777
2.75%
jan 1, 1981
19.582K
-131.069
-0.66%
jan 1, 1982
19.274K
-307.5
-1.57%
jan 1, 1983
19.327K
+52.946
0.27%
jan 1, 1984
19.661K
+333.826
1.73%
jan 1, 1985
20.112K
+450.741
2.29%
jan 1, 1986
20.572K
+460.225
2.29%
jan 1, 1987
21.515K
+943.016
4.58%
jan 1, 1988
22.067K
+551.746
2.56%
jan 1, 1989
23.005K
+938.688
4.25%
jan 1, 1990
23.799K
+793.481
3.45%
jan 1, 1991
24.561K
+762.232
3.2%
jan 1, 1992
25.034K
+472.515
1.92%
jan 1, 1993
25.303K
+269.113
1.08%
jan 1, 1994
24.973K
-329.945
-1.3%
jan 1, 1995
25.47K
+496.852
1.99%
jan 1, 1996
26.14K
+670.383
2.63%
jan 1, 1997
26.569K
+428.715
1.64%
jan 1, 1998
27.24K
+671.323
2.53%
jan 1, 1999
28.071K
+830.956
3.05%
jan 1, 2000
28.868K
+796.657
2.84%
jan 1, 2001
29.502K
+634.533
2.2%
jan 1, 2002
29.926K
+423.928
1.44%
jan 1, 2003
30.06K
+133.327
0.45%
jan 1, 2004
30.163K
+103.162
0.34%
jan 1, 2005
30.817K
+654.715
2.17%
jan 1, 2006
31.001K
+183.783
0.6%
jan 1, 2007
31.829K
+828.218
2.67%
jan 1, 2008
32.567K
+737.421
2.32%
jan 1, 2009
31.996K
-571.046
-1.75%
jan 1, 2010
30.681K
-1.314K
-4.11%
jan 1, 2011
31.133K
+452.055
1.47%
jan 1, 2012
31.289K
+155.398
0.5%
jan 1, 2013
30.923K
-365.773
-1.17%
jan 1, 2014
30.676K
-246.993
-0.8%
jan 1, 2015
31.118K
+442.287
1.44%
Ranking of countries by current statistics by years


Comments: