29
/
en
AIzaSyAYiBZKx7MnpbEhh9jyipgxe19OcubqV5w
April 1, 2024
143932
Guatemala
GTM
true
2
1
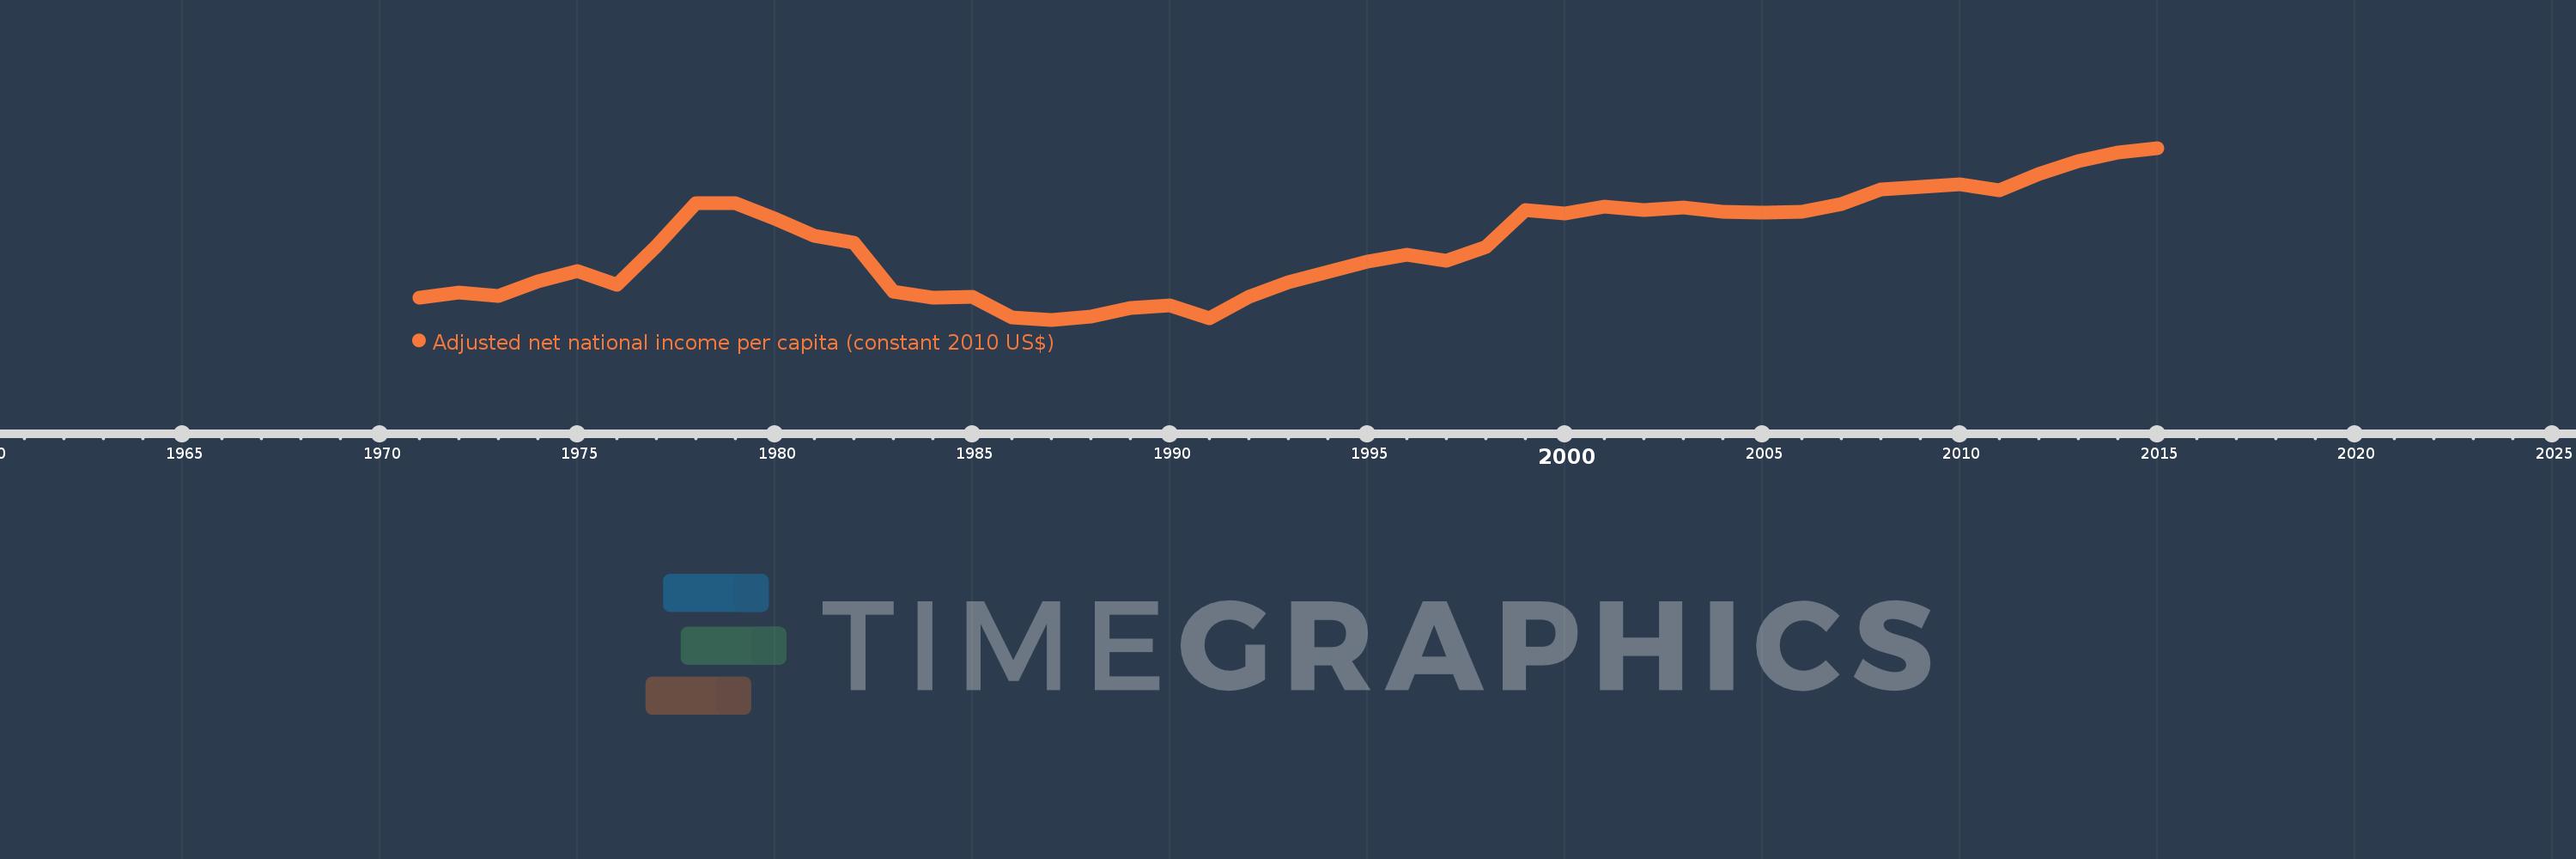
Adjusted net national income per capita (constant 2010 US$)
2015,2014,2013,2012,2011,2010,2009,2008,2007,2006,2005,2004,2003,2002,2001,2000,1999,1998,1997,1996,1995,1994,1993,1992,1991,1990,1989,1988,1987,1986,1985,1984,1983,1982,1981,1980,1979,1978,1977,1976,1975,1974,1973,1972,1971
This statistics in other country:
AfghanistanAlbaniaAlgeriaAngolaArab WorldArgentinaArmeniaAustraliaAustriaAzerbaijanBahamas, TheBahrainBangladeshBarbadosBelarusBelgiumBelizeBeninBhutanBoliviaBotswanaBrazilBulgariaBurkina FasoBurundiCabo VerdeCambodiaCameroonCanadaCaribbean small statesCentral African RepublicCentral Europe and the BalticsChadChileChinaColombiaComorosCongo, Dem. Rep.Congo, Rep.Costa RicaCote d'IvoireCroatiaCubaCyprusCzech RepublicDenmarkDominicaDominican RepublicEarly-demographic dividendEast Asia & PacificEast Asia & Pacific (excluding high income)East Asia & Pacific (IDA & IBRD countries)EcuadorEgypt, Arab Rep.El SalvadorEritreaEstoniaEthiopiaEuro areaEurope & Central AsiaEurope & Central Asia (excluding high income)Europe & Central Asia (IDA & IBRD countries)European UnionFijiFinlandFragile and conflict affected situationsFranceGabonGambia, TheGeorgiaGermanyGhanaGreeceGuatemalaGuineaGuinea-BissauGuyanaHaitiHeavily indebted poor countries (HIPC)High incomeHondurasHungaryIBRD onlyIDA & IBRD totalIDA blendIDA onlyIDA totalIndiaIndonesiaIran, Islamic Rep.IraqIrelandIsraelItalyJamaicaJapanJordanKazakhstanKenyaKiribatiKorea, Rep.KuwaitKyrgyz RepublicLao PDRLate-demographic dividendLatin America & Caribbean Latin America & Caribbean (excluding high income)Latin America & the Caribbean (IDA & IBRD countries)LatviaLeast developed countries: UN classificationLebanonLesothoLiberiaLibyaLithuaniaLow & middle incomeLow incomeLower middle incomeLuxembourgMacedonia, FYRMadagascarMalawiMalaysiaMaldivesMaliMauritaniaMauritiusMexicoMiddle East & North AfricaMiddle East & North Africa (excluding high income)Middle East & North Africa (IDA & IBRD countries)Middle incomeMoldovaMongoliaMoroccoMozambiqueNamibiaNepalNetherlandsNew ZealandNicaraguaNigerNigeriaNorth AmericaNorwayOECD membersOmanOther small statesPacific island small statesPakistanPanamaPapua New GuineaParaguayPeruPhilippinesPolandPortugalPost-demographic dividendPre-demographic dividendQatarRomaniaRussian FederationRwandaSamoaSao Tome and PrincipeSaudi ArabiaSenegalSeychellesSierra LeoneSingaporeSlovak RepublicSloveniaSmall statesSolomon IslandsSouth AfricaSouth AsiaSouth Asia (IDA & IBRD)SpainSri LankaSt. LuciaSt. Vincent and the GrenadinesSub-Saharan Africa Sub-Saharan Africa (excluding high income)Sub-Saharan Africa (IDA & IBRD countries)SurinameSwazilandSwedenSwitzerlandTajikistanTanzaniaThailandTogoTongaTrinidad and TobagoTunisiaTurkeyTurkmenistanUgandaUkraineUnited Arab EmiratesUnited KingdomUnited StatesUpper middle incomeUruguayUzbekistanVanuatuVenezuela, RBVietnamWorldYemen, Rep.ZambiaZimbabwe Timeline:
This timeline shows a graph from 1971 to 2015 of Guatemala. No data until 1970. Number of actual observations by date: 45.
Source name:
World Development Indicators
Source organization:
NULWorld Bank staff estimates based on sources and methods in World Bank's "The Changing Wealth of Nations: Measuring Sustainable Development in the New Millennium" (2011).L
Categories, topics:
Economy & Growth
Last updated:
apr 23, 2017
Indicators value changes by year
Maximum:
2.602K
jan 1, 2015
At the date of observation
Value
Absolute change
Change from previous value
jan 1, 1971
1.86K
+1.86K
0.0%
jan 1, 1972
1.886K
+25.533
1.37%
jan 1, 1973
1.868K
-18.075
-0.96%
jan 1, 1974
1.938K
+70.631
3.78%
jan 1, 1975
1.992K
+54.231
2.8%
jan 1, 1976
1.922K
-70.179
-3.52%
jan 1, 1977
2.115K
+192.462
10.01%
jan 1, 1978
2.328K
+213.79
10.11%
jan 1, 1979
2.328K
-0.094
0.0%
jan 1, 1980
2.251K
-77.217
-3.32%
jan 1, 1981
2.168K
-83.026
-3.69%
jan 1, 1982
2.132K
-36.269
-1.67%
jan 1, 1983
1.89K
-242.206
-11.36%
jan 1, 1984
1.86K
-29.486
-1.56%
jan 1, 1985
1.862K
+1.341
0.07%
jan 1, 1986
1.759K
-102.223
-5.49%
jan 1, 1987
1.75K
-9.671
-0.55%
jan 1, 1988
1.765K
+15.157
0.87%
jan 1, 1989
1.807K
+42.016
2.38%
jan 1, 1990
1.822K
+15.054
0.83%
jan 1, 1991
1.755K
-66.896
-3.67%
jan 1, 1992
1.863K
+108.441
6.18%
jan 1, 1993
1.936K
+72.28
3.88%
jan 1, 1994
1.988K
+52.511
2.71%
jan 1, 1995
2.039K
+50.41
2.54%
jan 1, 1996
2.074K
+35.406
1.74%
jan 1, 1997
2.045K
-29.423
-1.42%
jan 1, 1998
2.113K
+68.057
3.33%
jan 1, 1999
2.295K
+182.556
8.64%
jan 1, 2000
2.278K
-16.852
-0.73%
jan 1, 2001
2.309K
+31.009
1.36%
jan 1, 2002
2.293K
-15.861
-0.69%
jan 1, 2003
2.308K
+14.13
0.62%
jan 1, 2004
2.287K
-20.801
-0.9%
jan 1, 2005
2.281K
-5.42
-0.24%
jan 1, 2006
2.285K
+3.879
0.17%
jan 1, 2007
2.324K
+39.156
1.71%
jan 1, 2008
2.396K
+71.481
3.08%
jan 1, 2009
2.41K
+14.171
0.59%
jan 1, 2010
2.424K
+13.738
0.57%
jan 1, 2011
2.394K
-30.006
-1.24%
jan 1, 2012
2.475K
+81.007
3.38%
jan 1, 2013
2.538K
+62.805
2.54%
jan 1, 2014
2.578K
+40.366
1.59%
jan 1, 2015
2.602K
+24.369
0.95%
Ranking of countries by current statistics by years


Comments: