29
/
en
AIzaSyAYiBZKx7MnpbEhh9jyipgxe19OcubqV5w
April 1, 2024
201172
Morocco
MAR
true
2
1
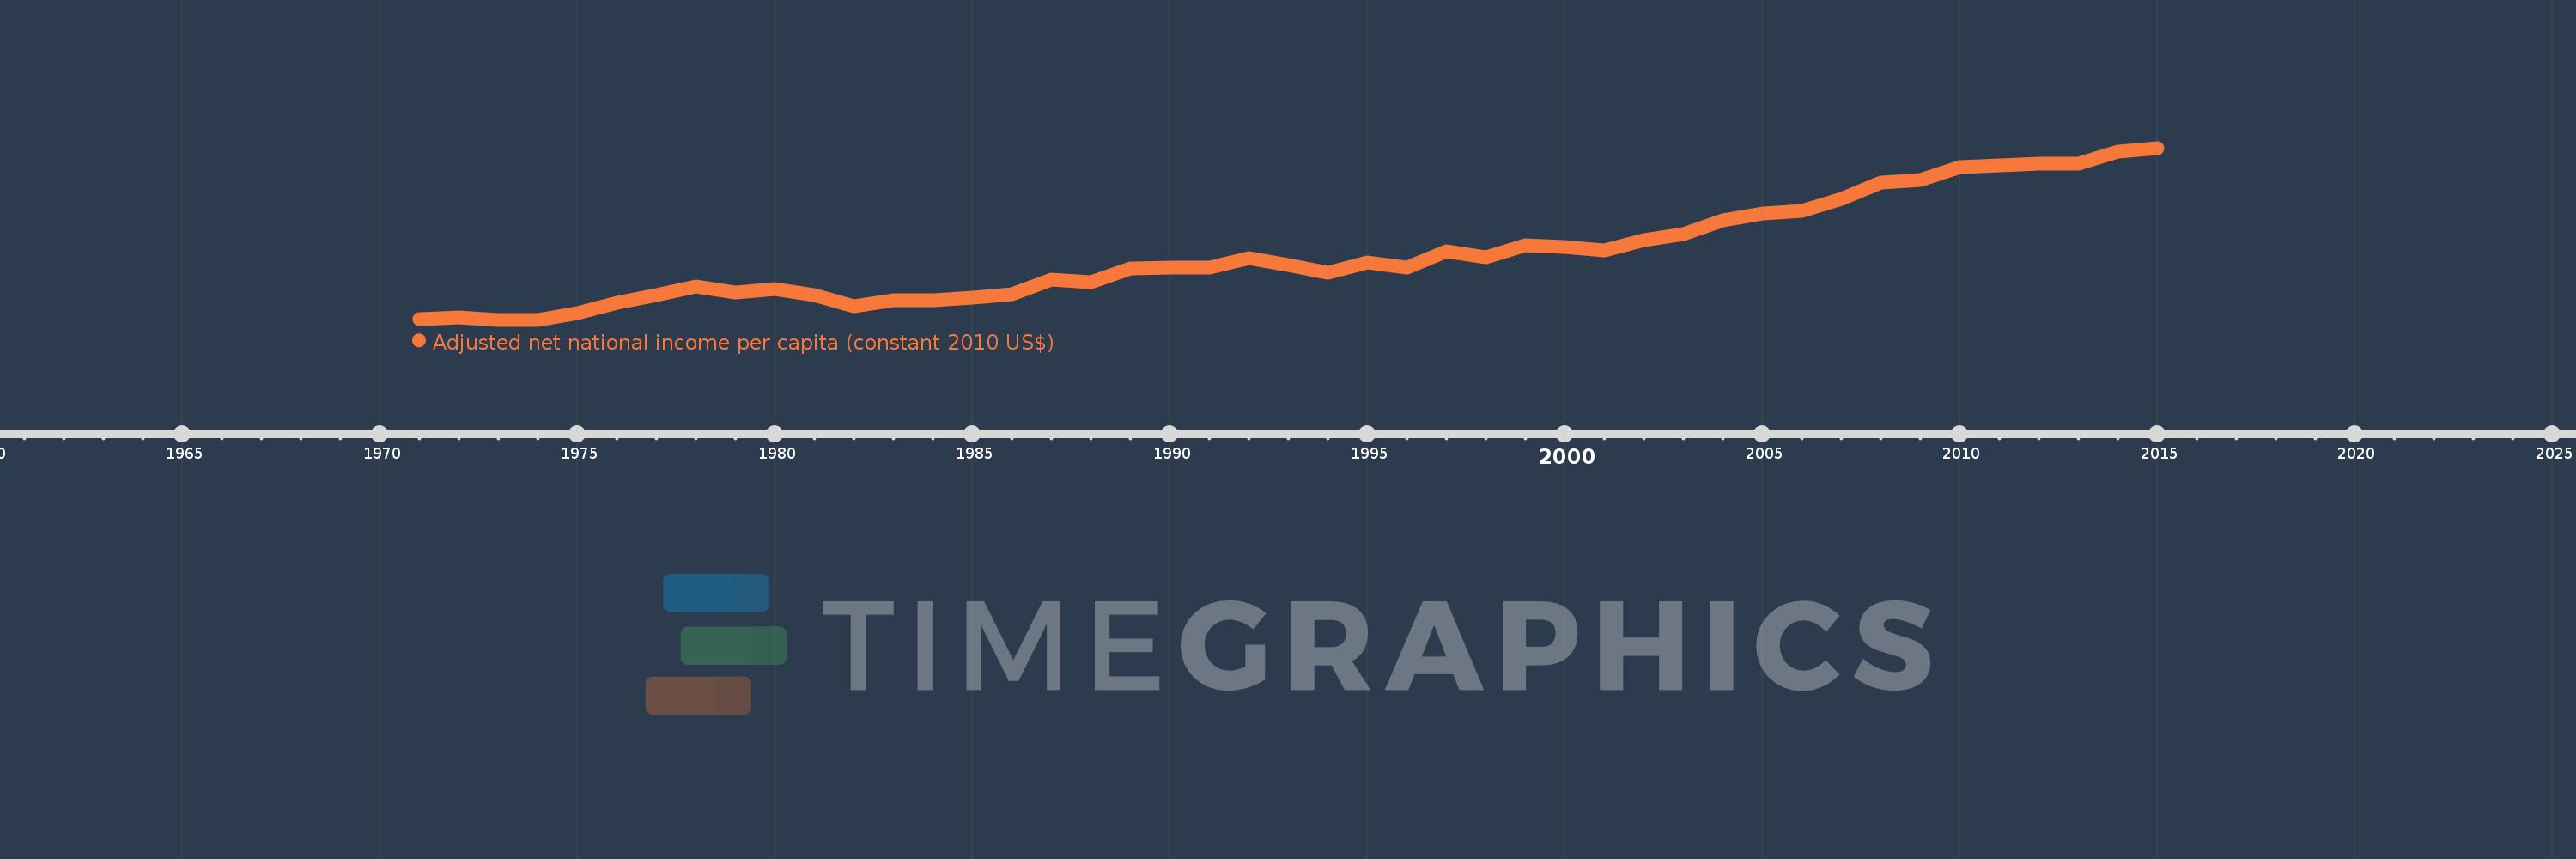
Adjusted net national income per capita (constant 2010 US$)
2015,2014,2013,2012,2011,2010,2009,2008,2007,2006,2005,2004,2003,2002,2001,2000,1999,1998,1997,1996,1995,1994,1993,1992,1991,1990,1989,1988,1987,1986,1985,1984,1983,1982,1981,1980,1979,1978,1977,1976,1975,1974,1973,1972,1971
This statistics in other country:
AfghanistanAlbaniaAlgeriaAngolaArab WorldArgentinaArmeniaAustraliaAustriaAzerbaijanBahamas, TheBahrainBangladeshBarbadosBelarusBelgiumBelizeBeninBhutanBoliviaBotswanaBrazilBulgariaBurkina FasoBurundiCabo VerdeCambodiaCameroonCanadaCaribbean small statesCentral African RepublicCentral Europe and the BalticsChadChileChinaColombiaComorosCongo, Dem. Rep.Congo, Rep.Costa RicaCote d'IvoireCroatiaCubaCyprusCzech RepublicDenmarkDominicaDominican RepublicEarly-demographic dividendEast Asia & PacificEast Asia & Pacific (excluding high income)East Asia & Pacific (IDA & IBRD countries)EcuadorEgypt, Arab Rep.El SalvadorEritreaEstoniaEthiopiaEuro areaEurope & Central AsiaEurope & Central Asia (excluding high income)Europe & Central Asia (IDA & IBRD countries)European UnionFijiFinlandFragile and conflict affected situationsFranceGabonGambia, TheGeorgiaGermanyGhanaGreeceGuatemalaGuineaGuinea-BissauGuyanaHaitiHeavily indebted poor countries (HIPC)High incomeHondurasHungaryIBRD onlyIDA & IBRD totalIDA blendIDA onlyIDA totalIndiaIndonesiaIran, Islamic Rep.IraqIrelandIsraelItalyJamaicaJapanJordanKazakhstanKenyaKiribatiKorea, Rep.KuwaitKyrgyz RepublicLao PDRLate-demographic dividendLatin America & Caribbean Latin America & Caribbean (excluding high income)Latin America & the Caribbean (IDA & IBRD countries)LatviaLeast developed countries: UN classificationLebanonLesothoLiberiaLibyaLithuaniaLow & middle incomeLow incomeLower middle incomeLuxembourgMacedonia, FYRMadagascarMalawiMalaysiaMaldivesMaliMauritaniaMauritiusMexicoMiddle East & North AfricaMiddle East & North Africa (excluding high income)Middle East & North Africa (IDA & IBRD countries)Middle incomeMoldovaMongoliaMoroccoMozambiqueNamibiaNepalNetherlandsNew ZealandNicaraguaNigerNigeriaNorth AmericaNorwayOECD membersOmanOther small statesPacific island small statesPakistanPanamaPapua New GuineaParaguayPeruPhilippinesPolandPortugalPost-demographic dividendPre-demographic dividendQatarRomaniaRussian FederationRwandaSamoaSao Tome and PrincipeSaudi ArabiaSenegalSeychellesSierra LeoneSingaporeSlovak RepublicSloveniaSmall statesSolomon IslandsSouth AfricaSouth AsiaSouth Asia (IDA & IBRD)SpainSri LankaSt. LuciaSt. Vincent and the GrenadinesSub-Saharan Africa Sub-Saharan Africa (excluding high income)Sub-Saharan Africa (IDA & IBRD countries)SurinameSwazilandSwedenSwitzerlandTajikistanTanzaniaThailandTogoTongaTrinidad and TobagoTunisiaTurkeyTurkmenistanUgandaUkraineUnited Arab EmiratesUnited KingdomUnited StatesUpper middle incomeUruguayUzbekistanVanuatuVenezuela, RBVietnamWorldYemen, Rep.ZambiaZimbabwe Timeline:
This timeline shows a graph from 1971 to 2015 of Morocco. No data until 1970. Number of actual observations by date: 45.
Source name:
World Development Indicators
Source organization:
NULWorld Bank staff estimates based on sources and methods in World Bank's "The Changing Wealth of Nations: Measuring Sustainable Development in the New Millennium" (2011).L
Categories, topics:
Economy & Growth
Last updated:
apr 23, 2017
Indicators value changes by year
Minimum:
919.751
jan 1, 1973
Maximum:
2.581K
jan 1, 2015
At the date of observation
Value
Absolute change
Change from previous value
jan 1, 1971
922.202
+922.202
0.0%
jan 1, 1972
938.252
+16.05
1.74%
jan 1, 1973
919.751
-18.501
-1.97%
jan 1, 1974
920.415
+0.664
0.07%
jan 1, 1975
980.244
+59.829
6.5%
jan 1, 1976
1.079K
+99.01
10.1%
jan 1, 1977
1.16K
+80.556
7.46%
jan 1, 1978
1.244K
+84.624
7.3%
jan 1, 1979
1.185K
-59.319
-4.77%
jan 1, 1980
1.213K
+27.46
2.32%
jan 1, 1981
1.16K
-52.493
-4.33%
jan 1, 1982
1.052K
-108.578
-9.36%
jan 1, 1983
1.112K
+60.435
5.75%
jan 1, 1984
1.106K
-6.063
-0.55%
jan 1, 1985
1.129K
+23.274
2.1%
jan 1, 1986
1.169K
+39.701
3.52%
jan 1, 1987
1.311K
+142.268
12.17%
jan 1, 1988
1.285K
-25.865
-1.97%
jan 1, 1989
1.414K
+129.152
10.05%
jan 1, 1990
1.421K
+6.531
0.46%
jan 1, 1991
1.426K
+5.107
0.36%
jan 1, 1992
1.513K
+87.389
6.13%
jan 1, 1993
1.445K
-68.536
-4.53%
jan 1, 1994
1.373K
-71.986
-4.98%
jan 1, 1995
1.472K
+99.533
7.25%
jan 1, 1996
1.421K
-50.996
-3.46%
jan 1, 1997
1.578K
+156.478
11.01%
jan 1, 1998
1.524K
-53.465
-3.39%
jan 1, 1999
1.641K
+116.449
7.64%
jan 1, 2000
1.625K
-15.717
-0.96%
jan 1, 2001
1.592K
-33.214
-2.04%
jan 1, 2002
1.69K
+98.25
6.17%
jan 1, 2003
1.747K
+56.742
3.36%
jan 1, 2004
1.88K
+133.413
7.64%
jan 1, 2005
1.944K
+63.545
3.38%
jan 1, 2006
1.972K
+28.383
1.46%
jan 1, 2007
2.09K
+117.817
5.97%
jan 1, 2008
2.243K
+152.613
7.3%
jan 1, 2009
2.274K
+31.156
1.39%
jan 1, 2010
2.399K
+125.444
5.52%
jan 1, 2011
2.41K
+10.614
0.44%
jan 1, 2012
2.429K
+19.007
0.79%
jan 1, 2013
2.43K
+1.305
0.05%
jan 1, 2014
2.547K
+116.989
4.81%
jan 1, 2015
2.581K
+33.399
1.31%
Ranking of countries by current statistics by years


Comments: