29
/
en
AIzaSyAYiBZKx7MnpbEhh9jyipgxe19OcubqV5w
April 1, 2024
192670
Mauritania
MRT
true
2
1
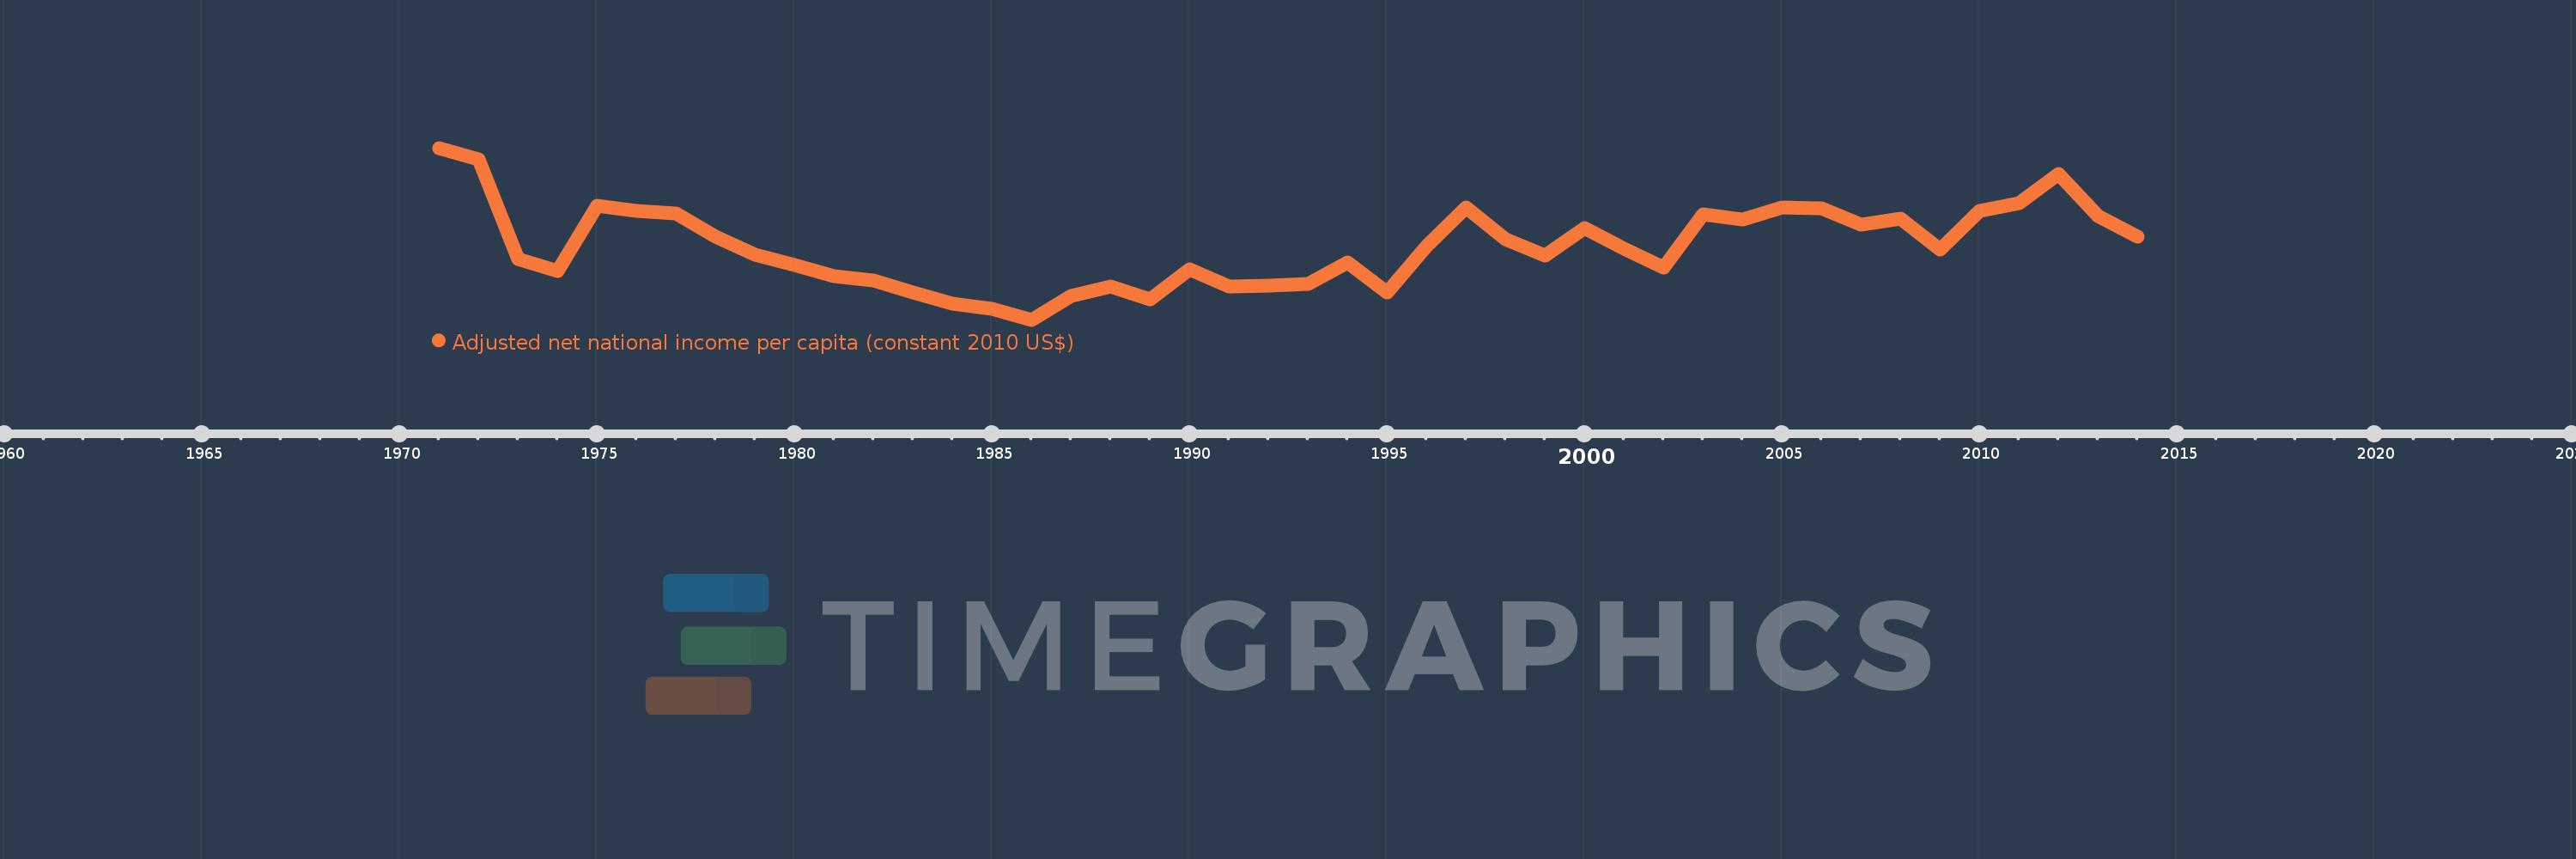
Adjusted net national income per capita (constant 2010 US$)
2014,2013,2012,2011,2010,2009,2008,2007,2006,2005,2004,2003,2002,2001,2000,1999,1998,1997,1996,1995,1994,1993,1992,1991,1990,1989,1988,1987,1986,1985,1984,1983,1982,1981,1980,1979,1978,1977,1976,1975,1974,1973,1972,1971
This statistics in other country:
AfghanistanAlbaniaAlgeriaAngolaArab WorldArgentinaArmeniaAustraliaAustriaAzerbaijanBahamas, TheBahrainBangladeshBarbadosBelarusBelgiumBelizeBeninBhutanBoliviaBotswanaBrazilBulgariaBurkina FasoBurundiCabo VerdeCambodiaCameroonCanadaCaribbean small statesCentral African RepublicCentral Europe and the BalticsChadChileChinaColombiaComorosCongo, Dem. Rep.Congo, Rep.Costa RicaCote d'IvoireCroatiaCubaCyprusCzech RepublicDenmarkDominicaDominican RepublicEarly-demographic dividendEast Asia & PacificEast Asia & Pacific (excluding high income)East Asia & Pacific (IDA & IBRD countries)EcuadorEgypt, Arab Rep.El SalvadorEritreaEstoniaEthiopiaEuro areaEurope & Central AsiaEurope & Central Asia (excluding high income)Europe & Central Asia (IDA & IBRD countries)European UnionFijiFinlandFragile and conflict affected situationsFranceGabonGambia, TheGeorgiaGermanyGhanaGreeceGuatemalaGuineaGuinea-BissauGuyanaHaitiHeavily indebted poor countries (HIPC)High incomeHondurasHungaryIBRD onlyIDA & IBRD totalIDA blendIDA onlyIDA totalIndiaIndonesiaIran, Islamic Rep.IraqIrelandIsraelItalyJamaicaJapanJordanKazakhstanKenyaKiribatiKorea, Rep.KuwaitKyrgyz RepublicLao PDRLate-demographic dividendLatin America & Caribbean Latin America & Caribbean (excluding high income)Latin America & the Caribbean (IDA & IBRD countries)LatviaLeast developed countries: UN classificationLebanonLesothoLiberiaLibyaLithuaniaLow & middle incomeLow incomeLower middle incomeLuxembourgMacedonia, FYRMadagascarMalawiMalaysiaMaldivesMaliMauritaniaMauritiusMexicoMiddle East & North AfricaMiddle East & North Africa (excluding high income)Middle East & North Africa (IDA & IBRD countries)Middle incomeMoldovaMongoliaMoroccoMozambiqueNamibiaNepalNetherlandsNew ZealandNicaraguaNigerNigeriaNorth AmericaNorwayOECD membersOmanOther small statesPacific island small statesPakistanPanamaPapua New GuineaParaguayPeruPhilippinesPolandPortugalPost-demographic dividendPre-demographic dividendQatarRomaniaRussian FederationRwandaSamoaSao Tome and PrincipeSaudi ArabiaSenegalSeychellesSierra LeoneSingaporeSlovak RepublicSloveniaSmall statesSolomon IslandsSouth AfricaSouth AsiaSouth Asia (IDA & IBRD)SpainSri LankaSt. LuciaSt. Vincent and the GrenadinesSub-Saharan Africa Sub-Saharan Africa (excluding high income)Sub-Saharan Africa (IDA & IBRD countries)SurinameSwazilandSwedenSwitzerlandTajikistanTanzaniaThailandTogoTongaTrinidad and TobagoTunisiaTurkeyTurkmenistanUgandaUkraineUnited Arab EmiratesUnited KingdomUnited StatesUpper middle incomeUruguayUzbekistanVanuatuVenezuela, RBVietnamWorldYemen, Rep.ZambiaZimbabwe Timeline:
This timeline shows a graph from 1971 to 2014 of Mauritania. No data until 1970. Number of actual observations by date: 44.
Source name:
World Development Indicators
Source organization:
NULWorld Bank staff estimates based on sources and methods in World Bank's "The Changing Wealth of Nations: Measuring Sustainable Development in the New Millennium" (2011).L
Categories, topics:
Economy & Growth
Last updated:
apr 23, 2017
Indicators value changes by year
Minimum:
527.402
jan 1, 1986
Maximum:
839.829
jan 1, 1971
At the date of observation
Value
Absolute change
Change from previous value
jan 1, 1971
839.829
+839.829
0.0%
jan 1, 1972
819.574
-20.254
-2.41%
jan 1, 1973
638.256
-181.318
-22.12%
jan 1, 1974
615.666
-22.59
-3.54%
jan 1, 1975
735.255
+119.589
19.42%
jan 1, 1976
726.003
-9.252
-1.26%
jan 1, 1977
720.003
-6.0
-0.83%
jan 1, 1978
678.756
-41.247
-5.73%
jan 1, 1979
645.849
-32.908
-4.85%
jan 1, 1980
626.283
-19.566
-3.03%
jan 1, 1981
606.193
-20.091
-3.21%
jan 1, 1982
598.71
-7.482
-1.23%
jan 1, 1983
577.109
-21.602
-3.61%
jan 1, 1984
556.402
-20.707
-3.59%
jan 1, 1985
547.617
-8.785
-1.58%
jan 1, 1986
527.402
-20.214
-3.69%
jan 1, 1987
570.982
+43.579
8.26%
jan 1, 1988
588.576
+17.595
3.08%
jan 1, 1989
563.84
-24.736
-4.2%
jan 1, 1990
618.451
+54.611
9.69%
jan 1, 1991
588.252
-30.199
-4.88%
jan 1, 1992
589.662
+1.409
0.24%
jan 1, 1993
593.199
+3.538
0.6%
jan 1, 1994
631.761
+38.562
6.5%
jan 1, 1995
577.168
-54.594
-8.64%
jan 1, 1996
661.739
+84.571
14.65%
jan 1, 1997
731.562
+69.824
10.55%
jan 1, 1998
674.434
-57.128
-7.81%
jan 1, 1999
644.723
-29.71
-4.41%
jan 1, 2000
694.312
+49.588
7.69%
jan 1, 2001
657.27
-37.042
-5.34%
jan 1, 2002
622.564
-34.706
-5.28%
jan 1, 2003
718.438
+95.874
15.4%
jan 1, 2004
710.329
-8.109
-1.13%
jan 1, 2005
731.812
+21.483
3.02%
jan 1, 2006
730.283
-1.529
-0.21%
jan 1, 2007
700.156
-30.127
-4.13%
jan 1, 2008
711.191
+11.035
1.58%
jan 1, 2009
654.365
-56.826
-7.99%
jan 1, 2010
725.991
+71.626
10.95%
jan 1, 2011
739.381
+13.39
1.84%
jan 1, 2012
792.993
+53.612
7.25%
jan 1, 2013
716.444
-76.549
-9.65%
jan 1, 2014
678.747
-37.697
-5.26%
Ranking of countries by current statistics by years


Comments: