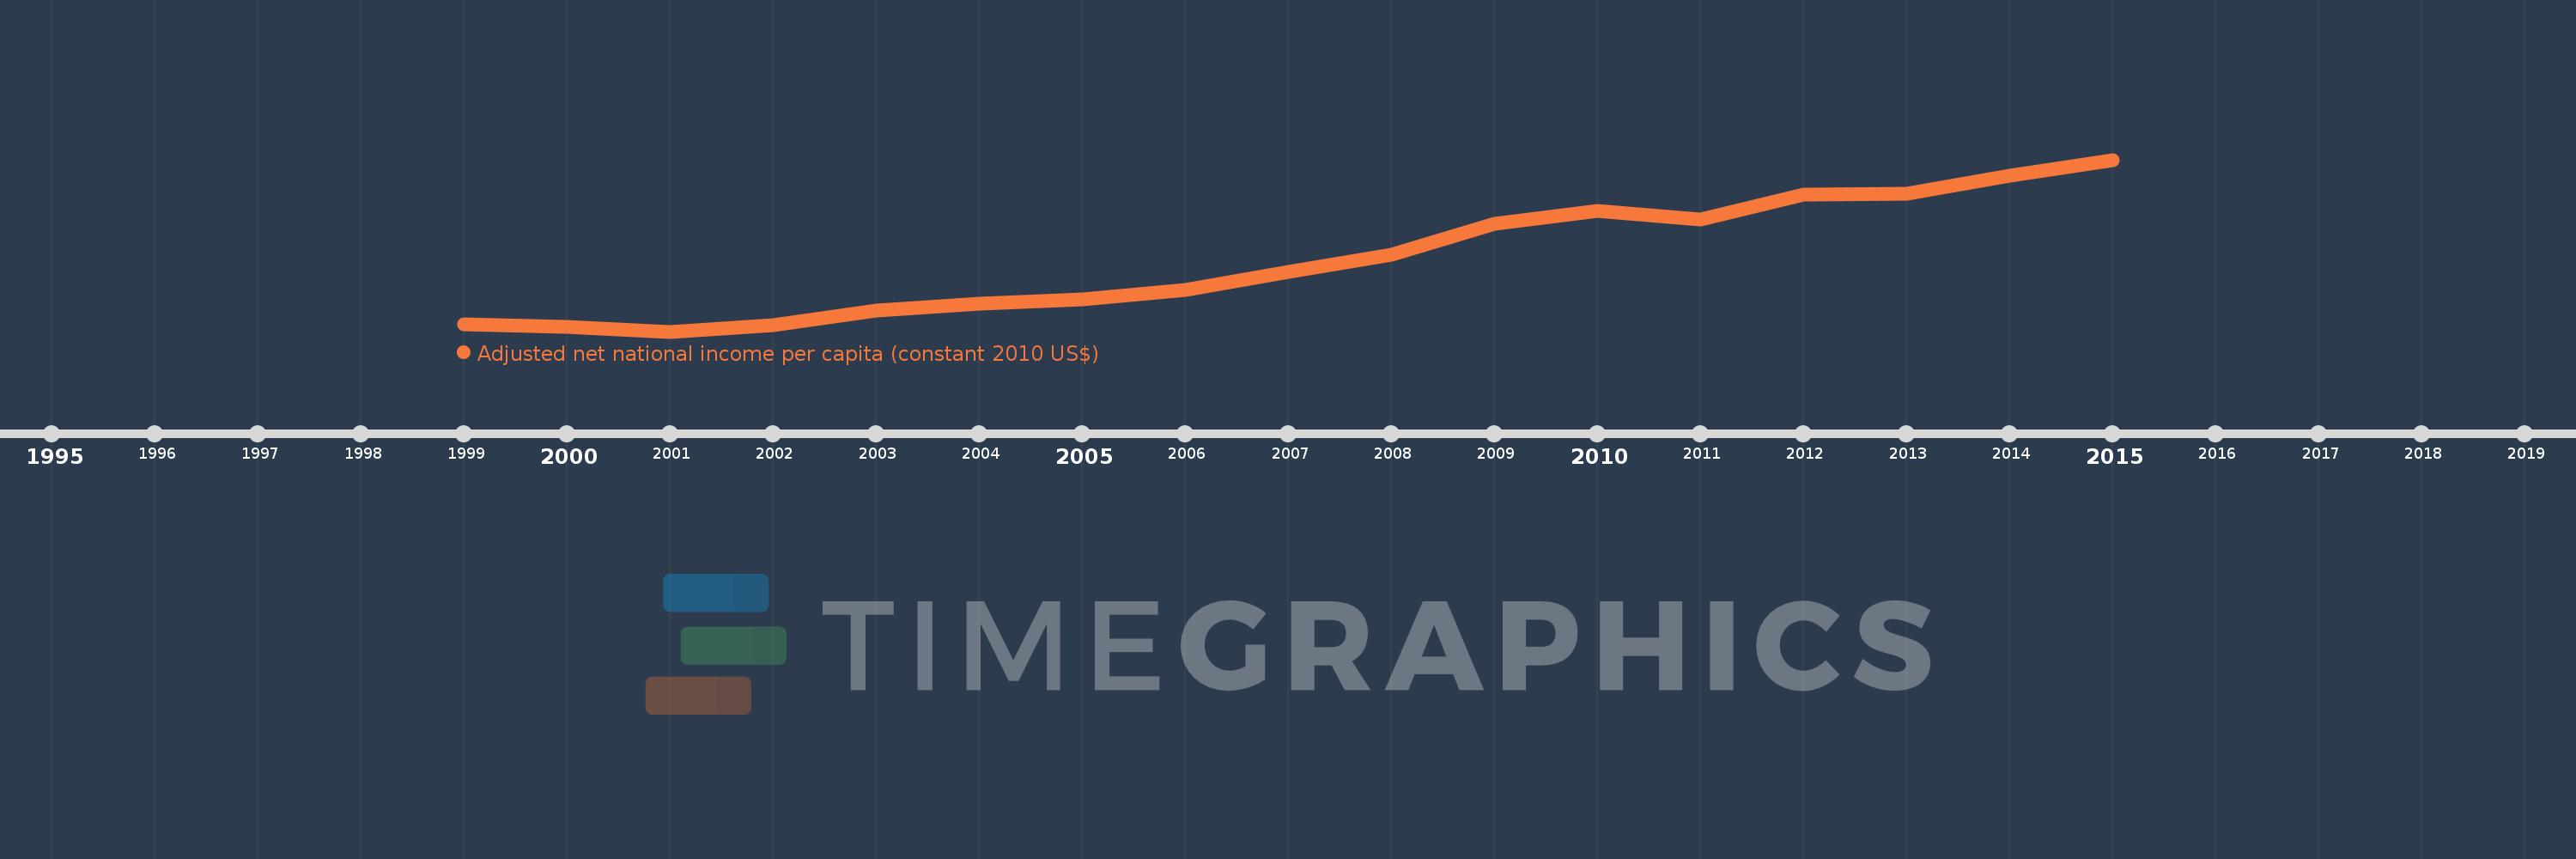
This timeline shows a graph from 1999 to 2015 of Azerbaijan. No data until 1998. Number of actual observations by date: 17.
Source name:
World Development Indicators
Source organization:
NULWorld Bank staff estimates based on sources and methods in World Bank's "The Changing Wealth of Nations: Measuring Sustainable Development in the New Millennium" (2011).L
Categories, topics:
Economy & Growth
Last updated:
apr 23, 2017
Indicators value changes by year
Meaning:
2.253K
Minimum:
590.277
jan 1, 2001
Maximum:
4.564K
jan 1, 2015
At the date of observation
Value
Absolute change
Change from the previous value
jan 1, 1999
761.96
+761.96
0.0%
jan 1, 2000
703.941
-58.02
-7.61%
jan 1, 2001
590.277
-113.664
-16.15%
jan 1, 2002
730.441
+140.164
23.75%
jan 1, 2003
1.081K
+350.657
48.01%
jan 1, 2004
1.228K
+147.01
13.6%
jan 1, 2005
1.339K
+110.877
9.03%
jan 1, 2006
1.553K
+214.181
16.0%
jan 1, 2007
1.981K
+427.603
27.53%
jan 1, 2008
2.376K
+394.803
19.93%
jan 1, 2009
3.09K
+714.083
30.06%
jan 1, 2010
3.388K
+298.657
9.67%
jan 1, 2011
3.193K
-195.532
-5.77%
jan 1, 2012
3.764K
+571.15
17.89%
jan 1, 2013
3.776K
+11.905
0.32%
jan 1, 2014
4.188K
+411.714
10.9%
jan 1, 2015
4.564K
+376.281
8.99%
Ranking of countries by current statistics by years
