29
/
en
AIzaSyAYiBZKx7MnpbEhh9jyipgxe19OcubqV5w
April 1, 2024
184766
Madagascar
MDG
true
2
1
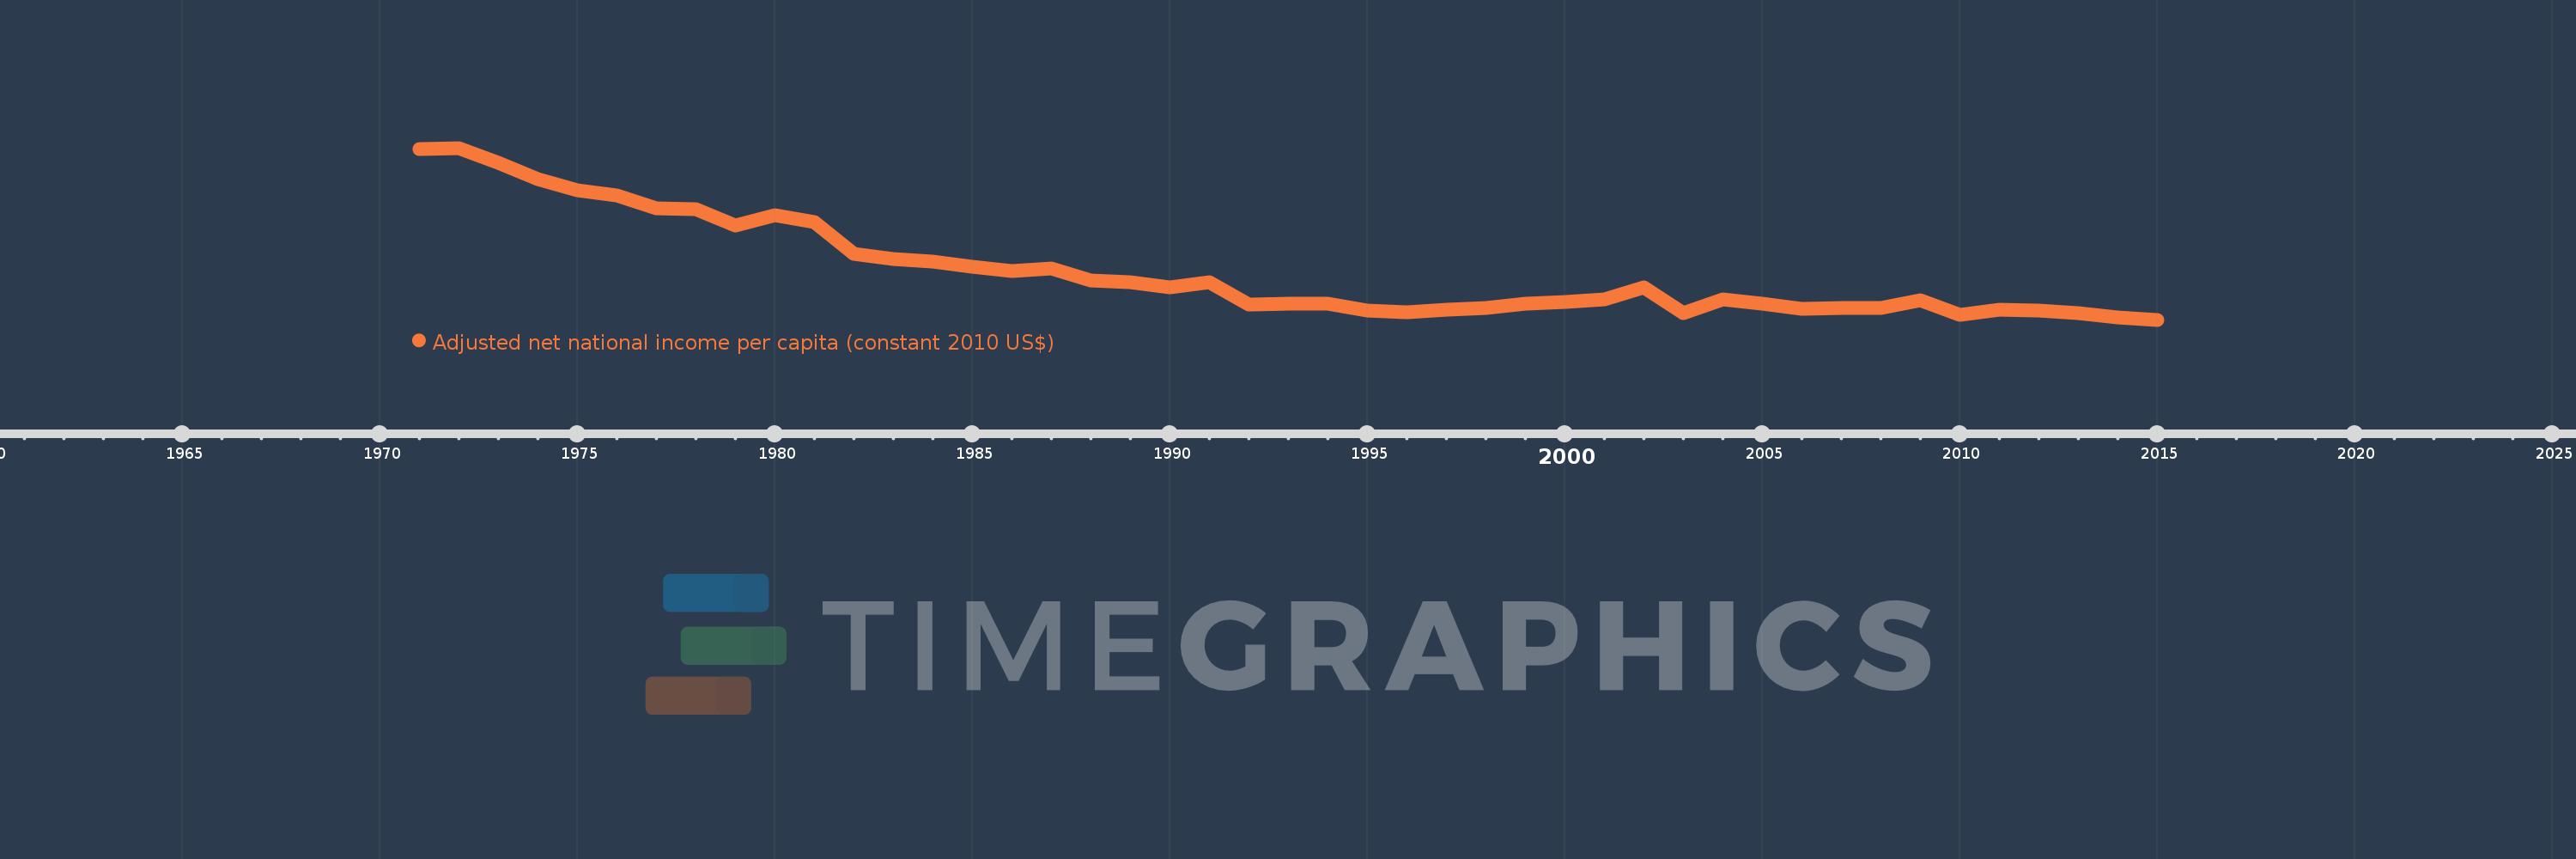
Adjusted net national income per capita (constant 2010 US$)
2015,2014,2013,2012,2011,2010,2009,2008,2007,2006,2005,2004,2003,2002,2001,2000,1999,1998,1997,1996,1995,1994,1993,1992,1991,1990,1989,1988,1987,1986,1985,1984,1983,1982,1981,1980,1979,1978,1977,1976,1975,1974,1973,1972,1971
This statistics in other country:
AfghanistanAlbaniaAlgeriaAngolaArab WorldArgentinaArmeniaAustraliaAustriaAzerbaijanBahamas, TheBahrainBangladeshBarbadosBelarusBelgiumBelizeBeninBhutanBoliviaBotswanaBrazilBulgariaBurkina FasoBurundiCabo VerdeCambodiaCameroonCanadaCaribbean small statesCentral African RepublicCentral Europe and the BalticsChadChileChinaColombiaComorosCongo, Dem. Rep.Congo, Rep.Costa RicaCote d'IvoireCroatiaCubaCyprusCzech RepublicDenmarkDominicaDominican RepublicEarly-demographic dividendEast Asia & PacificEast Asia & Pacific (excluding high income)East Asia & Pacific (IDA & IBRD countries)EcuadorEgypt, Arab Rep.El SalvadorEritreaEstoniaEthiopiaEuro areaEurope & Central AsiaEurope & Central Asia (excluding high income)Europe & Central Asia (IDA & IBRD countries)European UnionFijiFinlandFragile and conflict affected situationsFranceGabonGambia, TheGeorgiaGermanyGhanaGreeceGuatemalaGuineaGuinea-BissauGuyanaHaitiHeavily indebted poor countries (HIPC)High incomeHondurasHungaryIBRD onlyIDA & IBRD totalIDA blendIDA onlyIDA totalIndiaIndonesiaIran, Islamic Rep.IraqIrelandIsraelItalyJamaicaJapanJordanKazakhstanKenyaKiribatiKorea, Rep.KuwaitKyrgyz RepublicLao PDRLate-demographic dividendLatin America & Caribbean Latin America & Caribbean (excluding high income)Latin America & the Caribbean (IDA & IBRD countries)LatviaLeast developed countries: UN classificationLebanonLesothoLiberiaLibyaLithuaniaLow & middle incomeLow incomeLower middle incomeLuxembourgMacedonia, FYRMadagascarMalawiMalaysiaMaldivesMaliMauritaniaMauritiusMexicoMiddle East & North AfricaMiddle East & North Africa (excluding high income)Middle East & North Africa (IDA & IBRD countries)Middle incomeMoldovaMongoliaMoroccoMozambiqueNamibiaNepalNetherlandsNew ZealandNicaraguaNigerNigeriaNorth AmericaNorwayOECD membersOmanOther small statesPacific island small statesPakistanPanamaPapua New GuineaParaguayPeruPhilippinesPolandPortugalPost-demographic dividendPre-demographic dividendQatarRomaniaRussian FederationRwandaSamoaSao Tome and PrincipeSaudi ArabiaSenegalSeychellesSierra LeoneSingaporeSlovak RepublicSloveniaSmall statesSolomon IslandsSouth AfricaSouth AsiaSouth Asia (IDA & IBRD)SpainSri LankaSt. LuciaSt. Vincent and the GrenadinesSub-Saharan Africa Sub-Saharan Africa (excluding high income)Sub-Saharan Africa (IDA & IBRD countries)SurinameSwazilandSwedenSwitzerlandTajikistanTanzaniaThailandTogoTongaTrinidad and TobagoTunisiaTurkeyTurkmenistanUgandaUkraineUnited Arab EmiratesUnited KingdomUnited StatesUpper middle incomeUruguayUzbekistanVanuatuVenezuela, RBVietnamWorldYemen, Rep.ZambiaZimbabwe Timeline:
This timeline shows a graph from 1971 to 2015 of Madagascar. No data until 1970. Number of actual observations by date: 45.
Source name:
World Development Indicators
Source organization:
NULWorld Bank staff estimates based on sources and methods in World Bank's "The Changing Wealth of Nations: Measuring Sustainable Development in the New Millennium" (2011).L
Categories, topics:
Economy & Growth
Last updated:
apr 23, 2017
Indicators value changes by year
Minimum:
345.181
jan 1, 2015
Maximum:
844.687
jan 1, 1972
At the date of observation
Value
Absolute change
Change from previous value
jan 1, 1971
841.951
+841.951
0.0%
jan 1, 1972
844.687
+2.736
0.32%
jan 1, 1973
801.302
-43.385
-5.14%
jan 1, 1974
753.333
-47.969
-5.99%
jan 1, 1975
720.829
-32.504
-4.31%
jan 1, 1976
706.638
-14.191
-1.97%
jan 1, 1977
669.598
-37.04
-5.24%
jan 1, 1978
666.516
-3.082
-0.46%
jan 1, 1979
618.793
-47.723
-7.16%
jan 1, 1980
648.984
+30.192
4.88%
jan 1, 1981
629.562
-19.422
-2.99%
jan 1, 1982
537.332
-92.23
-14.65%
jan 1, 1983
521.384
-15.948
-2.97%
jan 1, 1984
513.955
-7.43
-1.43%
jan 1, 1985
499.738
-14.217
-2.77%
jan 1, 1986
487.541
-12.197
-2.44%
jan 1, 1987
494.379
+6.838
1.4%
jan 1, 1988
458.8
-35.579
-7.2%
jan 1, 1989
453.184
-5.616
-1.22%
jan 1, 1990
439.147
-14.038
-3.1%
jan 1, 1991
453.219
+14.072
3.2%
jan 1, 1992
388.43
-64.79
-14.3%
jan 1, 1993
391.841
+3.412
0.88%
jan 1, 1994
391.056
-0.785
-0.2%
jan 1, 1995
373.005
-18.051
-4.62%
jan 1, 1996
367.01
-5.995
-1.61%
jan 1, 1997
374.485
+7.475
2.04%
jan 1, 1998
380.149
+5.664
1.51%
jan 1, 1999
392.762
+12.612
3.32%
jan 1, 2000
397.041
+4.28
1.09%
jan 1, 2001
405.49
+8.448
2.13%
jan 1, 2002
439.472
+33.982
8.38%
jan 1, 2003
364.708
-74.763
-17.01%
jan 1, 2004
403.55
+38.842
10.65%
jan 1, 2005
390.726
-12.824
-3.18%
jan 1, 2006
376.492
-14.235
-3.64%
jan 1, 2007
380.271
+3.779
1.0%
jan 1, 2008
380.226
-0.046
-0.01%
jan 1, 2009
400.91
+20.684
5.44%
jan 1, 2010
360.549
-40.361
-10.07%
jan 1, 2011
375.245
+14.696
4.08%
jan 1, 2012
372.58
-2.665
-0.71%
jan 1, 2013
364.349
-8.23
-2.21%
jan 1, 2014
351.768
-12.581
-3.45%
jan 1, 2015
345.181
-6.587
-1.87%
Ranking of countries by current statistics by years


Comments: