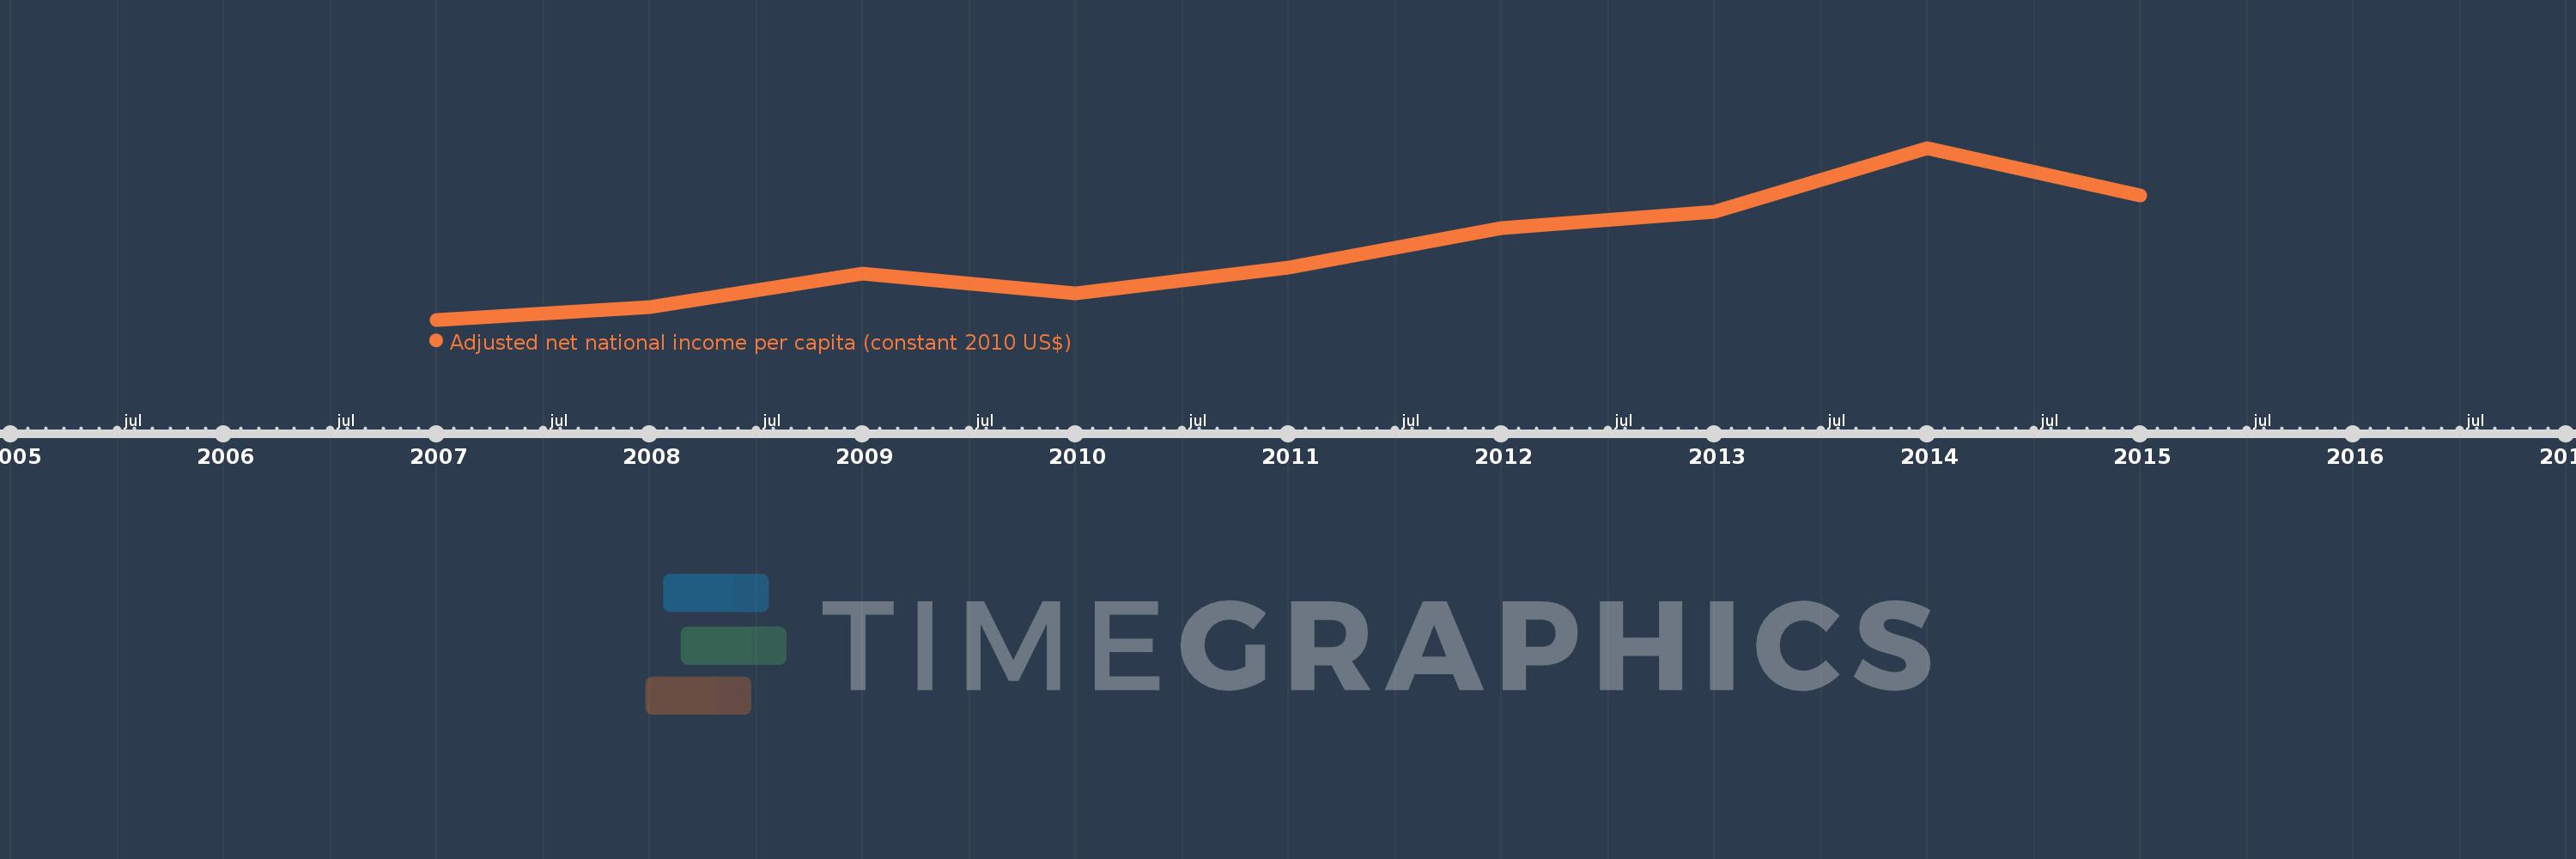
This timeline shows a graph from 2007 to 2015 of Ghana. No data until 2006. Number of actual observations by date: 9.
Source name:
World Development Indicators
Source organization:
NULWorld Bank staff estimates based on sources and methods in World Bank's "The Changing Wealth of Nations: Measuring Sustainable Development in the New Millennium" (2011).L
Categories, topics:
Economy & Growth
Last updated:
apr 23, 2017
Indicators value changes by year
Meaning:
1.127K
Minimum:
982.461
jan 1, 2007
Maximum:
1.334K
jan 1, 2014
At the date of observation
Value
Absolute change
Change from the previous value
jan 1, 2007
982.461
+982.461
0.0%
jan 1, 2008
1.009K
+26.454
2.69%
jan 1, 2009
1.077K
+68.368
6.78%
jan 1, 2010
1.036K
-41.407
-3.84%
jan 1, 2011
1.089K
+53.17
5.13%
jan 1, 2012
1.171K
+81.465
7.48%
jan 1, 2013
1.204K
+33.095
2.83%
jan 1, 2014
1.334K
+130.123
10.81%
jan 1, 2015
1.237K
-96.475
-7.23%
Ranking of countries by current statistics by years
