29
/
en
AIzaSyAYiBZKx7MnpbEhh9jyipgxe19OcubqV5w
April 1, 2024
230614
Rwanda
RWA
true
2
1
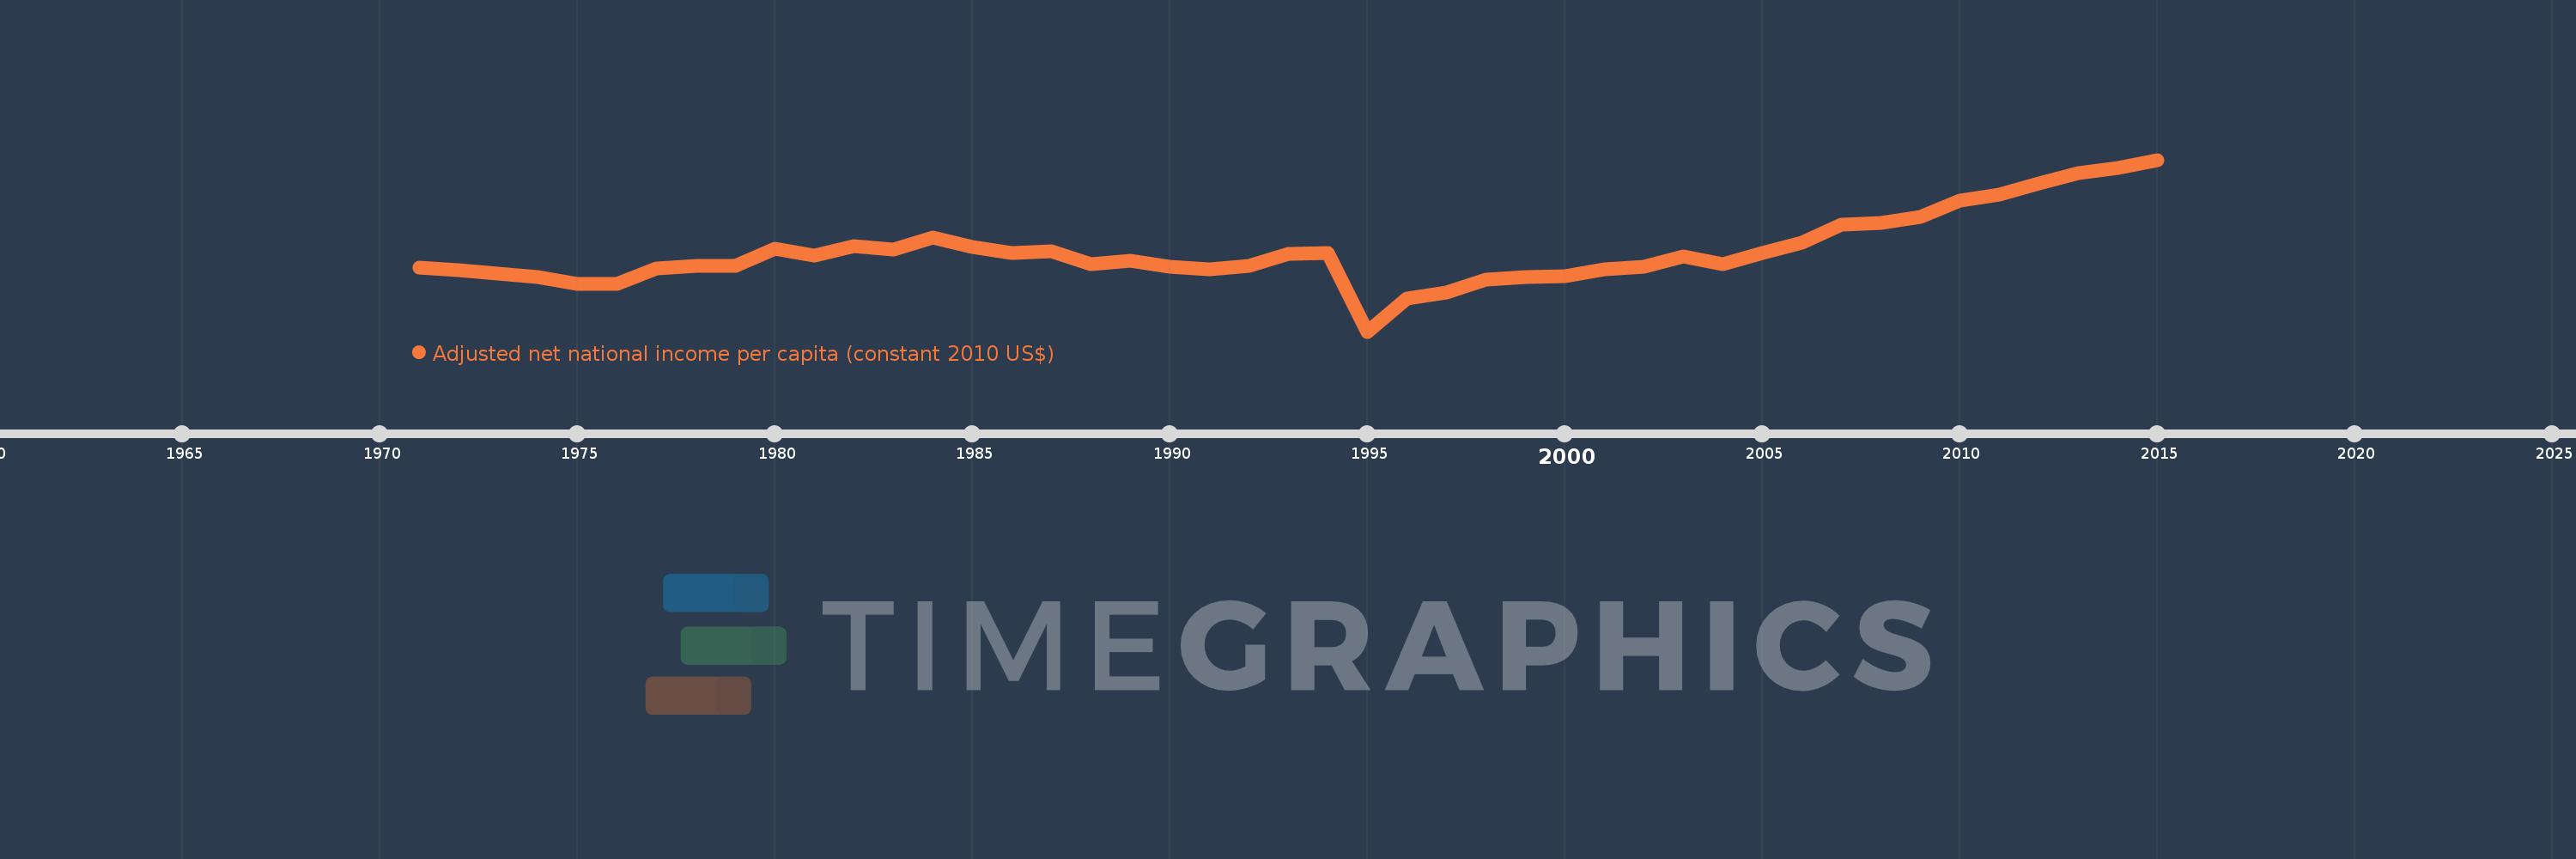
Adjusted net national income per capita (constant 2010 US$)
2015,2014,2013,2012,2011,2010,2009,2008,2007,2006,2005,2004,2003,2002,2001,2000,1999,1998,1997,1996,1995,1994,1993,1992,1991,1990,1989,1988,1987,1986,1985,1984,1983,1982,1981,1980,1979,1978,1977,1976,1975,1974,1973,1972,1971
This statistics in other country:
AfghanistanAlbaniaAlgeriaAngolaArab WorldArgentinaArmeniaAustraliaAustriaAzerbaijanBahamas, TheBahrainBangladeshBarbadosBelarusBelgiumBelizeBeninBhutanBoliviaBotswanaBrazilBulgariaBurkina FasoBurundiCabo VerdeCambodiaCameroonCanadaCaribbean small statesCentral African RepublicCentral Europe and the BalticsChadChileChinaColombiaComorosCongo, Dem. Rep.Congo, Rep.Costa RicaCote d'IvoireCroatiaCubaCyprusCzech RepublicDenmarkDominicaDominican RepublicEarly-demographic dividendEast Asia & PacificEast Asia & Pacific (excluding high income)East Asia & Pacific (IDA & IBRD countries)EcuadorEgypt, Arab Rep.El SalvadorEritreaEstoniaEthiopiaEuro areaEurope & Central AsiaEurope & Central Asia (excluding high income)Europe & Central Asia (IDA & IBRD countries)European UnionFijiFinlandFragile and conflict affected situationsFranceGabonGambia, TheGeorgiaGermanyGhanaGreeceGuatemalaGuineaGuinea-BissauGuyanaHaitiHeavily indebted poor countries (HIPC)High incomeHondurasHungaryIBRD onlyIDA & IBRD totalIDA blendIDA onlyIDA totalIndiaIndonesiaIran, Islamic Rep.IraqIrelandIsraelItalyJamaicaJapanJordanKazakhstanKenyaKiribatiKorea, Rep.KuwaitKyrgyz RepublicLao PDRLate-demographic dividendLatin America & Caribbean Latin America & Caribbean (excluding high income)Latin America & the Caribbean (IDA & IBRD countries)LatviaLeast developed countries: UN classificationLebanonLesothoLiberiaLibyaLithuaniaLow & middle incomeLow incomeLower middle incomeLuxembourgMacedonia, FYRMadagascarMalawiMalaysiaMaldivesMaliMauritaniaMauritiusMexicoMiddle East & North AfricaMiddle East & North Africa (excluding high income)Middle East & North Africa (IDA & IBRD countries)Middle incomeMoldovaMongoliaMoroccoMozambiqueNamibiaNepalNetherlandsNew ZealandNicaraguaNigerNigeriaNorth AmericaNorwayOECD membersOmanOther small statesPacific island small statesPakistanPanamaPapua New GuineaParaguayPeruPhilippinesPolandPortugalPost-demographic dividendPre-demographic dividendQatarRomaniaRussian FederationRwandaSamoaSao Tome and PrincipeSaudi ArabiaSenegalSeychellesSierra LeoneSingaporeSlovak RepublicSloveniaSmall statesSolomon IslandsSouth AfricaSouth AsiaSouth Asia (IDA & IBRD)SpainSri LankaSt. LuciaSt. Vincent and the GrenadinesSub-Saharan Africa Sub-Saharan Africa (excluding high income)Sub-Saharan Africa (IDA & IBRD countries)SurinameSwazilandSwedenSwitzerlandTajikistanTanzaniaThailandTogoTongaTrinidad and TobagoTunisiaTurkeyTurkmenistanUgandaUkraineUnited Arab EmiratesUnited KingdomUnited StatesUpper middle incomeUruguayUzbekistanVanuatuVenezuela, RBVietnamWorldYemen, Rep.ZambiaZimbabwe Timeline:
This timeline shows a graph from 1971 to 2015 of Rwanda. No data until 1970. Number of actual observations by date: 45.
Source name:
World Development Indicators
Source organization:
NULWorld Bank staff estimates based on sources and methods in World Bank's "The Changing Wealth of Nations: Measuring Sustainable Development in the New Millennium" (2011).L
Categories, topics:
Economy & Growth
Last updated:
apr 23, 2017
Indicators value changes by year
Minimum:
116.843
jan 1, 1995
Maximum:
567.85
jan 1, 2015
At the date of observation
Value
Absolute change
Change from previous value
jan 1, 1971
284.05
+284.05
0.0%
jan 1, 1972
278.487
-5.563
-1.96%
jan 1, 1973
268.506
-9.981
-3.58%
jan 1, 1974
259.224
-9.283
-3.46%
jan 1, 1975
241.916
-17.308
-6.68%
jan 1, 1976
242.865
+0.949
0.39%
jan 1, 1977
283.187
+40.322
16.6%
jan 1, 1978
288.763
+5.576
1.97%
jan 1, 1979
290.258
+1.495
0.52%
jan 1, 1980
333.355
+43.097
14.85%
jan 1, 1981
315.862
-17.493
-5.25%
jan 1, 1982
340.466
+24.605
7.79%
jan 1, 1983
333.166
-7.3
-2.14%
jan 1, 1984
363.462
+30.295
9.09%
jan 1, 1985
337.977
-25.484
-7.01%
jan 1, 1986
324.252
-13.725
-4.06%
jan 1, 1987
328.438
+4.186
1.29%
jan 1, 1988
293.727
-34.711
-10.57%
jan 1, 1989
302.603
+8.876
3.02%
jan 1, 1990
288.03
-14.573
-4.82%
jan 1, 1991
280.848
-7.182
-2.49%
jan 1, 1992
288.994
+8.146
2.9%
jan 1, 1993
321.95
+32.956
11.4%
jan 1, 1994
322.14
+0.19
0.06%
jan 1, 1995
116.843
-205.296
-63.73%
jan 1, 1996
204.409
+87.566
74.94%
jan 1, 1997
219.615
+15.206
7.44%
jan 1, 1998
253.581
+33.965
15.47%
jan 1, 1999
259.076
+5.495
2.17%
jan 1, 2000
261.242
+2.167
0.84%
jan 1, 2001
280.206
+18.964
7.26%
jan 1, 2002
287.087
+6.881
2.46%
jan 1, 2003
313.296
+26.209
9.13%
jan 1, 2004
294.186
-19.11
-6.1%
jan 1, 2005
323.65
+29.464
10.02%
jan 1, 2006
350.303
+26.653
8.24%
jan 1, 2007
396.554
+46.251
13.2%
jan 1, 2008
401.968
+5.413
1.37%
jan 1, 2009
418.686
+16.719
4.16%
jan 1, 2010
460.941
+42.255
10.09%
jan 1, 2011
475.957
+15.015
3.26%
jan 1, 2012
505.946
+29.989
6.3%
jan 1, 2013
533.328
+27.382
5.41%
jan 1, 2014
546.633
+13.306
2.49%
jan 1, 2015
567.85
+21.216
3.88%
Ranking of countries by current statistics by years


Comments: