29
/
en
AIzaSyAYiBZKx7MnpbEhh9jyipgxe19OcubqV5w
April 1, 2024
189821
Mali
MLI
true
2
1
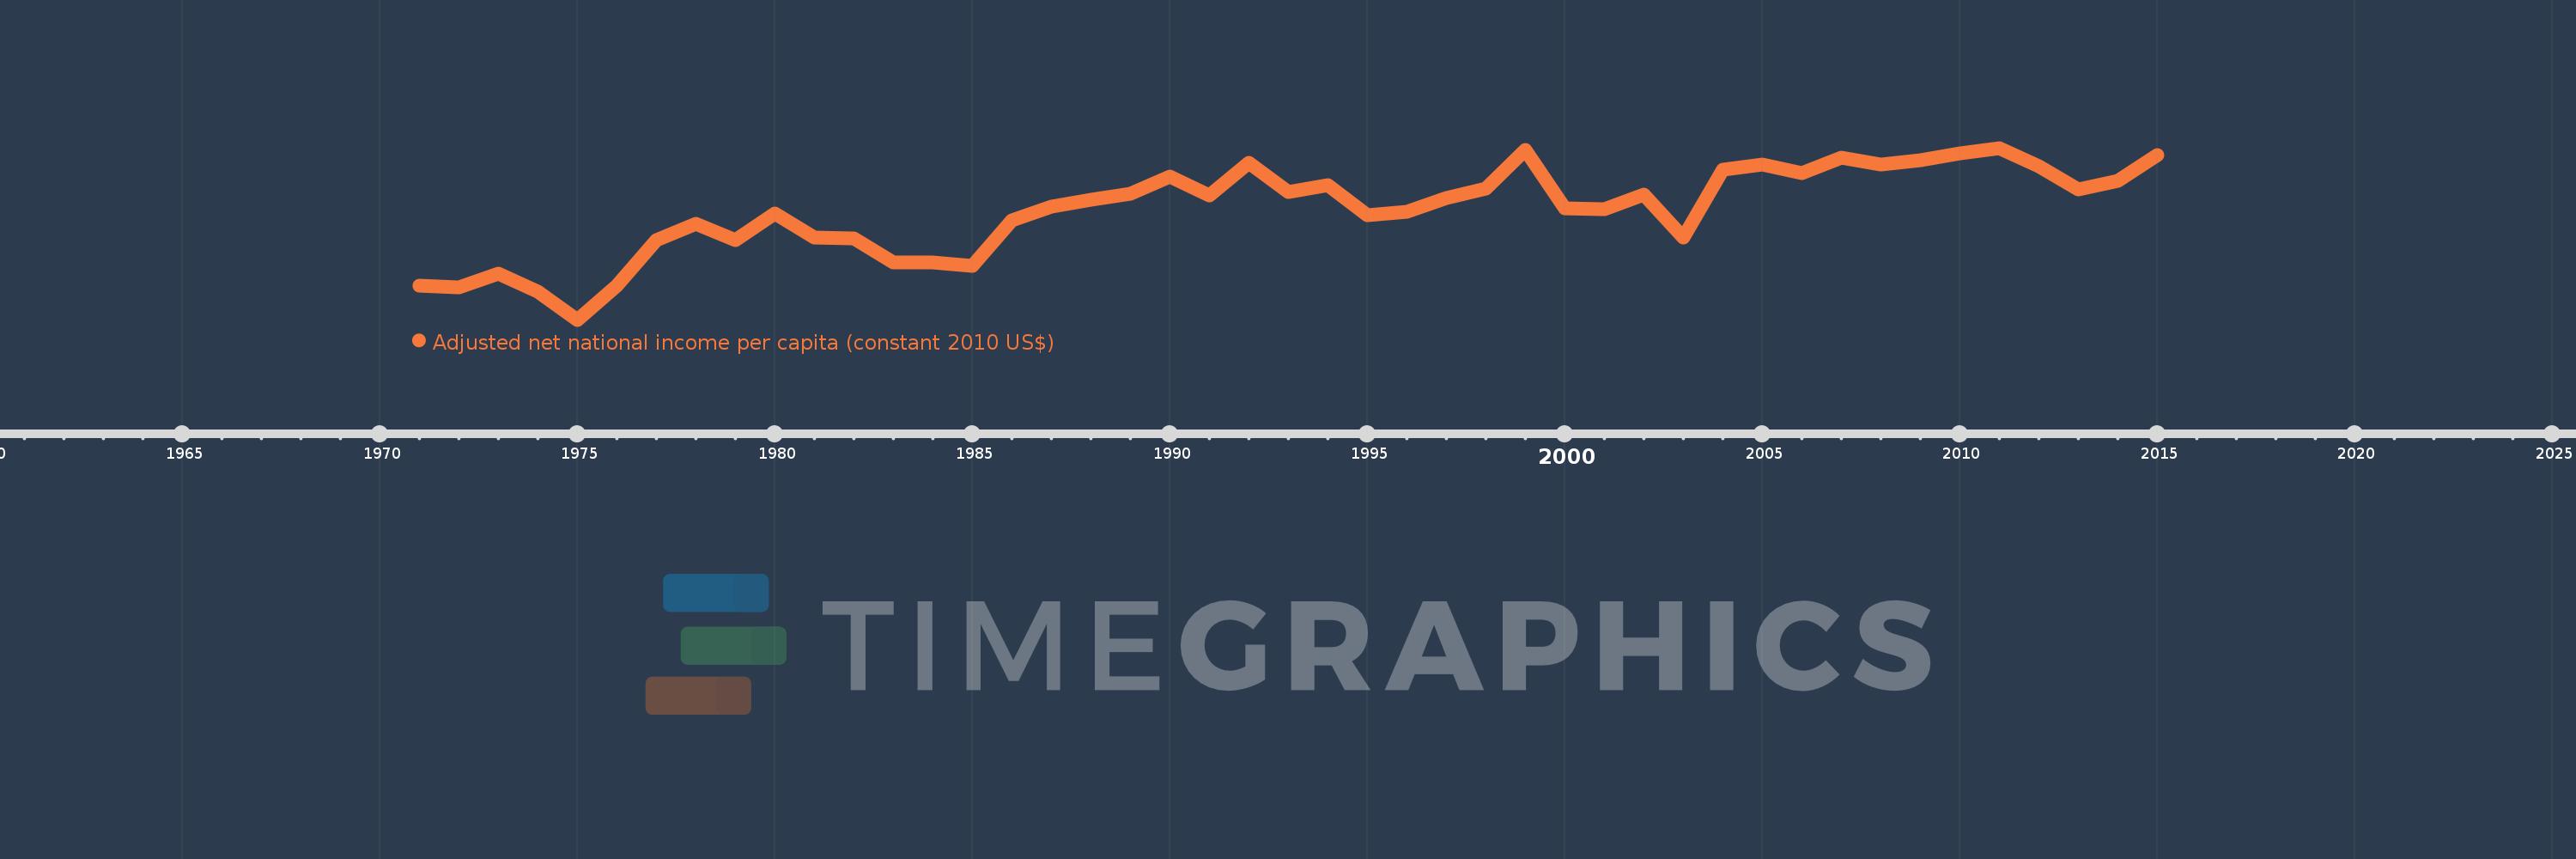
Adjusted net national income per capita (constant 2010 US$)
2015,2014,2013,2012,2011,2010,2009,2008,2007,2006,2005,2004,2003,2002,2001,2000,1999,1998,1997,1996,1995,1994,1993,1992,1991,1990,1989,1988,1987,1986,1985,1984,1983,1982,1981,1980,1979,1978,1977,1976,1975,1974,1973,1972,1971
This statistics in other country:
AfghanistanAlbaniaAlgeriaAngolaArab WorldArgentinaArmeniaAustraliaAustriaAzerbaijanBahamas, TheBahrainBangladeshBarbadosBelarusBelgiumBelizeBeninBhutanBoliviaBotswanaBrazilBulgariaBurkina FasoBurundiCabo VerdeCambodiaCameroonCanadaCaribbean small statesCentral African RepublicCentral Europe and the BalticsChadChileChinaColombiaComorosCongo, Dem. Rep.Congo, Rep.Costa RicaCote d'IvoireCroatiaCubaCyprusCzech RepublicDenmarkDominicaDominican RepublicEarly-demographic dividendEast Asia & PacificEast Asia & Pacific (excluding high income)East Asia & Pacific (IDA & IBRD countries)EcuadorEgypt, Arab Rep.El SalvadorEritreaEstoniaEthiopiaEuro areaEurope & Central AsiaEurope & Central Asia (excluding high income)Europe & Central Asia (IDA & IBRD countries)European UnionFijiFinlandFragile and conflict affected situationsFranceGabonGambia, TheGeorgiaGermanyGhanaGreeceGuatemalaGuineaGuinea-BissauGuyanaHaitiHeavily indebted poor countries (HIPC)High incomeHondurasHungaryIBRD onlyIDA & IBRD totalIDA blendIDA onlyIDA totalIndiaIndonesiaIran, Islamic Rep.IraqIrelandIsraelItalyJamaicaJapanJordanKazakhstanKenyaKiribatiKorea, Rep.KuwaitKyrgyz RepublicLao PDRLate-demographic dividendLatin America & Caribbean Latin America & Caribbean (excluding high income)Latin America & the Caribbean (IDA & IBRD countries)LatviaLeast developed countries: UN classificationLebanonLesothoLiberiaLibyaLithuaniaLow & middle incomeLow incomeLower middle incomeLuxembourgMacedonia, FYRMadagascarMalawiMalaysiaMaldivesMaliMauritaniaMauritiusMexicoMiddle East & North AfricaMiddle East & North Africa (excluding high income)Middle East & North Africa (IDA & IBRD countries)Middle incomeMoldovaMongoliaMoroccoMozambiqueNamibiaNepalNetherlandsNew ZealandNicaraguaNigerNigeriaNorth AmericaNorwayOECD membersOmanOther small statesPacific island small statesPakistanPanamaPapua New GuineaParaguayPeruPhilippinesPolandPortugalPost-demographic dividendPre-demographic dividendQatarRomaniaRussian FederationRwandaSamoaSao Tome and PrincipeSaudi ArabiaSenegalSeychellesSierra LeoneSingaporeSlovak RepublicSloveniaSmall statesSolomon IslandsSouth AfricaSouth AsiaSouth Asia (IDA & IBRD)SpainSri LankaSt. LuciaSt. Vincent and the GrenadinesSub-Saharan Africa Sub-Saharan Africa (excluding high income)Sub-Saharan Africa (IDA & IBRD countries)SurinameSwazilandSwedenSwitzerlandTajikistanTanzaniaThailandTogoTongaTrinidad and TobagoTunisiaTurkeyTurkmenistanUgandaUkraineUnited Arab EmiratesUnited KingdomUnited StatesUpper middle incomeUruguayUzbekistanVanuatuVenezuela, RBVietnamWorldYemen, Rep.ZambiaZimbabwe Timeline:
This timeline shows a graph from 1971 to 2015 of Mali. No data until 1970. Number of actual observations by date: 45.
Source name:
World Development Indicators
Source organization:
NULWorld Bank staff estimates based on sources and methods in World Bank's "The Changing Wealth of Nations: Measuring Sustainable Development in the New Millennium" (2011).L
Categories, topics:
Economy & Growth
Last updated:
apr 23, 2017
Indicators value changes by year
Minimum:
285.052
jan 1, 1975
Maximum:
493.162
jan 1, 2011
At the date of observation
Value
Absolute change
Change from previous value
jan 1, 1971
326.3
+326.3
0.0%
jan 1, 1972
323.763
-2.537
-0.78%
jan 1, 1973
340.583
+16.82
5.2%
jan 1, 1974
319.597
-20.986
-6.16%
jan 1, 1975
285.052
-34.545
-10.81%
jan 1, 1976
326.192
+41.14
14.43%
jan 1, 1977
381.052
+54.86
16.82%
jan 1, 1978
400.947
+19.895
5.22%
jan 1, 1979
381.787
-19.16
-4.78%
jan 1, 1980
413.79
+32.003
8.38%
jan 1, 1981
384.756
-29.034
-7.02%
jan 1, 1982
384.032
-0.723
-0.19%
jan 1, 1983
354.54
-29.493
-7.68%
jan 1, 1984
354.589
+0.049
0.01%
jan 1, 1985
350.152
-4.436
-1.25%
jan 1, 1986
405.304
+55.152
15.75%
jan 1, 1987
422.255
+16.951
4.18%
jan 1, 1988
430.913
+8.658
2.05%
jan 1, 1989
437.233
+6.32
1.47%
jan 1, 1990
458.279
+21.045
4.81%
jan 1, 1991
435.868
-22.41
-4.89%
jan 1, 1992
475.253
+39.385
9.04%
jan 1, 1993
439.638
-35.615
-7.49%
jan 1, 1994
447.605
+7.966
1.81%
jan 1, 1995
411.281
-36.324
-8.12%
jan 1, 1996
415.608
+4.327
1.05%
jan 1, 1997
432.156
+16.549
3.98%
jan 1, 1998
444.368
+12.211
2.83%
jan 1, 1999
491.188
+46.821
10.54%
jan 1, 2000
419.909
-71.279
-14.51%
jan 1, 2001
419.397
-0.512
-0.12%
jan 1, 2002
436.927
+17.529
4.18%
jan 1, 2003
384.273
-52.653
-12.05%
jan 1, 2004
467.128
+82.855
21.56%
jan 1, 2005
473.297
+6.169
1.32%
jan 1, 2006
463.008
-10.29
-2.17%
jan 1, 2007
481.615
+18.607
4.02%
jan 1, 2008
472.637
-8.978
-1.86%
jan 1, 2009
478.652
+6.015
1.27%
jan 1, 2010
486.628
+7.976
1.67%
jan 1, 2011
493.162
+6.534
1.34%
jan 1, 2012
470.746
-22.417
-4.55%
jan 1, 2013
443.346
-27.4
-5.82%
jan 1, 2014
453.2
+9.854
2.22%
jan 1, 2015
484.807
+31.607
6.97%
Ranking of countries by current statistics by years


Comments: