29
/
en
AIzaSyAYiBZKx7MnpbEhh9jyipgxe19OcubqV5w
April 1, 2024
76521
Bahamas, The
BHS
true
2
1
Other manufacturing (% of value added in manufacturing)
1999,1998,1997,1996,1993,1992,1991,1990,1988,1987,1984
This statistics in other country:
AlbaniaAlgeriaArgentinaAustraliaAustriaAzerbaijanBahamas, TheBahrainBangladeshBarbadosBelarusBelgiumBelizeBeninBoliviaBosnia and HerzegovinaBotswanaBrazilBulgariaBurkina FasoBurundiCambodiaCameroonCanadaCentral African RepublicChileChinaColombiaCongo, Rep.Costa RicaCote d'IvoireCroatiaCubaCyprusCzech RepublicDenmarkDominican RepublicEcuadorEgypt, Arab Rep.El SalvadorEritreaEstoniaEthiopiaFijiFinlandFranceGabonGambia, TheGeorgiaGermanyGhanaGreeceGuatemalaHondurasHong Kong SAR, ChinaHungaryIcelandIndiaIndonesiaIran, Islamic Rep.IraqIrelandIsraelItalyJamaicaJapanJordanKazakhstanKenyaKorea, Rep.KuwaitKyrgyz RepublicLao PDRLatviaLebanonLesothoLibyaLithuaniaLuxembourgMacao SAR, ChinaMacedonia, FYRMadagascarMalawiMalaysiaMaltaMauritiusMexicoMoldovaMongoliaMoroccoMozambiqueNamibiaNepalNetherlandsNew ZealandNicaraguaNigerNigeriaNorwayOmanPakistanPanamaPapua New GuineaParaguayPeruPhilippinesPolandPortugalPuerto RicoQatarRomaniaRussian FederationRwandaSaudi ArabiaSenegalSerbiaSierra LeoneSingaporeSlovak RepublicSloveniaSomaliaSouth AfricaSpainSri LankaSt. LuciaSudanSwazilandSwedenSwitzerlandSyrian Arab RepublicTanzaniaThailandTongaTrinidad and TobagoTunisiaTurkeyUgandaUkraineUnited Arab EmiratesUnited KingdomUnited StatesUruguayVenezuela, RBVietnamWest Bank and GazaYemen, Rep.Zambia Timeline:
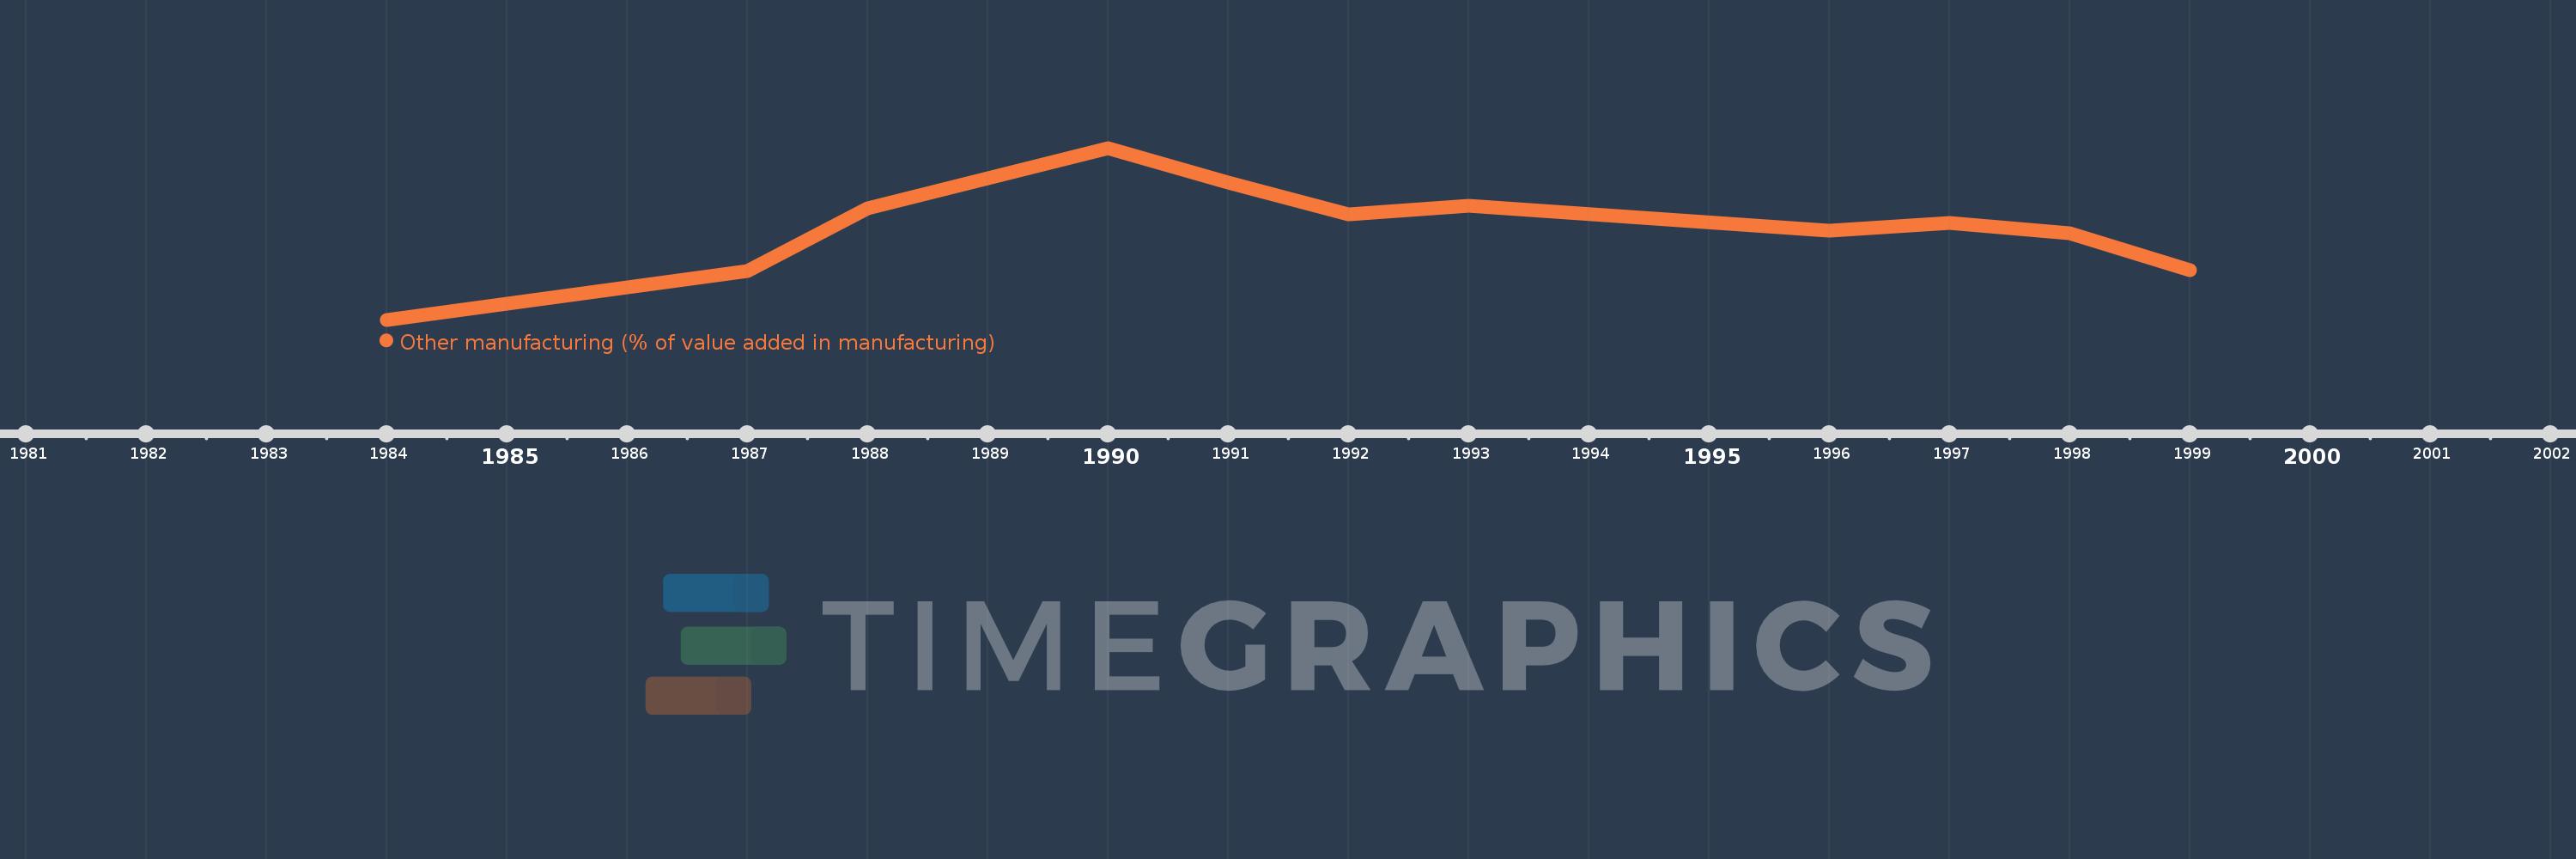
This timeline shows a graph from 1984 to 1999 of Bahamas, The. No data until 1983. Number of actual observations by date: 11.
Source name:
World Development Indicators
Source organization:
United Nations Industrial Development Organization, International Yearbook of Industrial Statistics.
Categories, topics:
Economy & Growth
Last updated:
apr 23, 2017
Indicators value changes by year
Maximum:
37.604
jan 1, 1990
At the date of observation
Value
Absolute change
Change from previous value
jan 1, 1984
8.357
+8.357
0.0%
jan 1, 1987
16.706
+8.348
99.9%
jan 1, 1988
27.318
+10.613
63.53%
jan 1, 1990
37.604
+10.286
37.65%
jan 1, 1991
31.645
-5.959
-15.85%
jan 1, 1992
26.31
-5.335
-16.86%
jan 1, 1993
27.783
+1.473
5.6%
jan 1, 1996
23.504
-4.278
-15.4%
jan 1, 1997
24.765
+1.26
5.36%
jan 1, 1998
23.035
-1.73
-6.99%
jan 1, 1999
16.78
-6.254
-27.15%
Ranking of countries by current statistics by years


Comments: