29
/
en
AIzaSyAYiBZKx7MnpbEhh9jyipgxe19OcubqV5w
April 1, 2024
285052
Yemen, Rep.
YEM
true
2
1
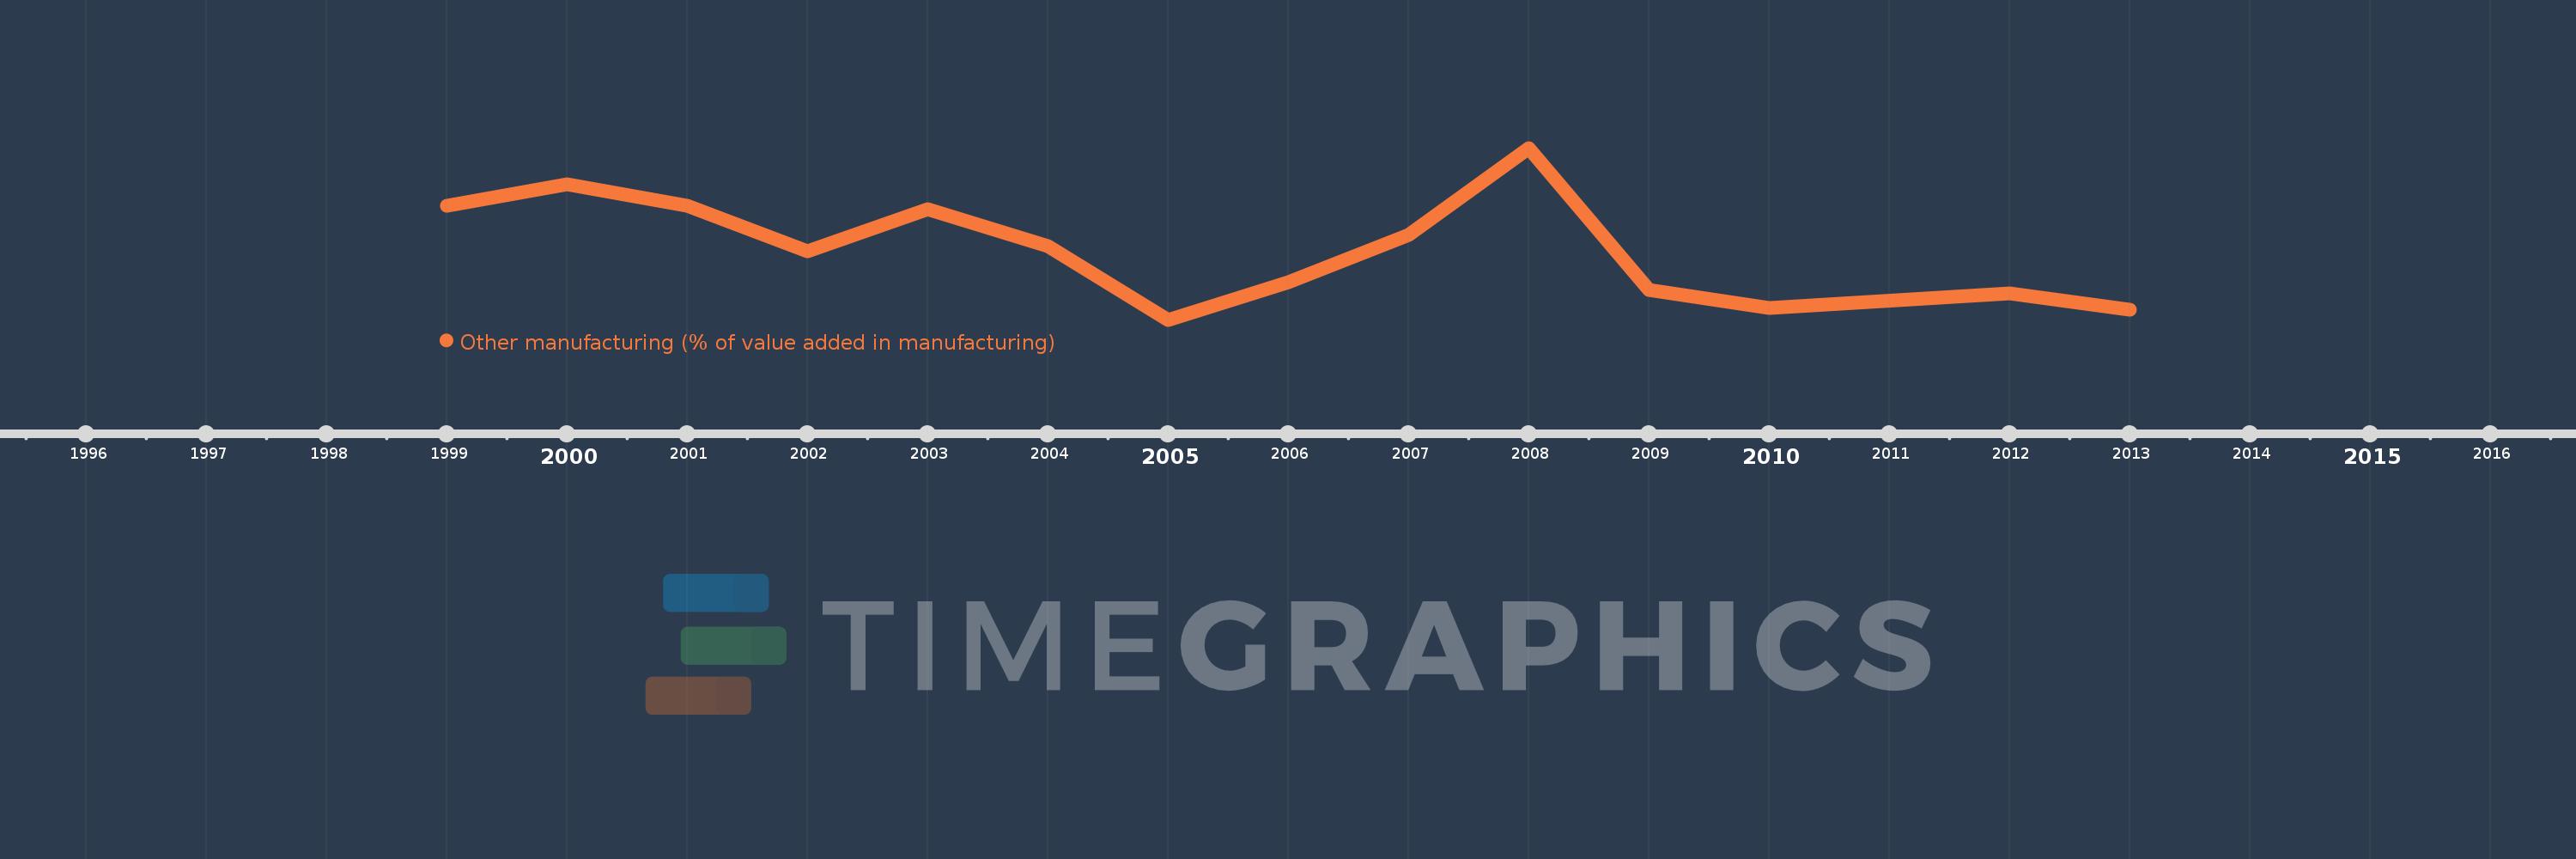
Other manufacturing (% of value added in manufacturing)
2013,2012,2010,2009,2008,2007,2006,2005,2004,2003,2002,2001,2000,1999
This statistics in other country:
AlbaniaAlgeriaArgentinaAustraliaAustriaAzerbaijanBahamas, TheBahrainBangladeshBarbadosBelarusBelgiumBelizeBeninBoliviaBosnia and HerzegovinaBotswanaBrazilBulgariaBurkina FasoBurundiCambodiaCameroonCanadaCentral African RepublicChileChinaColombiaCongo, Rep.Costa RicaCote d'IvoireCroatiaCubaCyprusCzech RepublicDenmarkDominican RepublicEcuadorEgypt, Arab Rep.El SalvadorEritreaEstoniaEthiopiaFijiFinlandFranceGabonGambia, TheGeorgiaGermanyGhanaGreeceGuatemalaHondurasHong Kong SAR, ChinaHungaryIcelandIndiaIndonesiaIran, Islamic Rep.IraqIrelandIsraelItalyJamaicaJapanJordanKazakhstanKenyaKorea, Rep.KuwaitKyrgyz RepublicLao PDRLatviaLebanonLesothoLibyaLithuaniaLuxembourgMacao SAR, ChinaMacedonia, FYRMadagascarMalawiMalaysiaMaltaMauritiusMexicoMoldovaMongoliaMoroccoMozambiqueNamibiaNepalNetherlandsNew ZealandNicaraguaNigerNigeriaNorwayOmanPakistanPanamaPapua New GuineaParaguayPeruPhilippinesPolandPortugalPuerto RicoQatarRomaniaRussian FederationRwandaSaudi ArabiaSenegalSerbiaSierra LeoneSingaporeSlovak RepublicSloveniaSomaliaSouth AfricaSpainSri LankaSt. LuciaSudanSwazilandSwedenSwitzerlandSyrian Arab RepublicTanzaniaThailandTongaTrinidad and TobagoTunisiaTurkeyUgandaUkraineUnited Arab EmiratesUnited KingdomUnited StatesUruguayVenezuela, RBVietnamWest Bank and GazaYemen, Rep.Zambia Timeline:
This timeline shows a graph from 1999 to 2013 of Yemen, Rep.. No data until 1998. Number of actual observations by date: 14.
Source name:
World Development Indicators
Source organization:
United Nations Industrial Development Organization, International Yearbook of Industrial Statistics.
Categories, topics:
Economy & Growth
Last updated:
apr 23, 2017
Indicators value changes by year
Minimum:
34.865
jan 1, 2005
Maximum:
54.316
jan 1, 2008
At the date of observation
Value
Absolute change
Change from previous value
jan 1, 1999
47.782
+47.782
0.0%
jan 1, 2000
50.216
+2.434
5.09%
jan 1, 2001
47.725
-2.491
-4.96%
jan 1, 2002
42.663
-5.062
-10.61%
jan 1, 2003
47.363
+4.7
11.02%
jan 1, 2004
43.239
-4.124
-8.71%
jan 1, 2005
34.865
-8.374
-19.37%
jan 1, 2006
39.128
+4.263
12.23%
jan 1, 2007
44.461
+5.333
13.63%
jan 1, 2008
54.316
+9.856
22.17%
jan 1, 2009
38.288
-16.028
-29.51%
jan 1, 2010
36.239
-2.049
-5.35%
jan 1, 2012
37.859
+1.62
4.47%
jan 1, 2013
35.956
-1.904
-5.03%
Ranking of countries by current statistics by years


Comments: