29
/
en
AIzaSyAYiBZKx7MnpbEhh9jyipgxe19OcubqV5w
April 1, 2024
283953
West Bank and Gaza
PSE
true
2
1
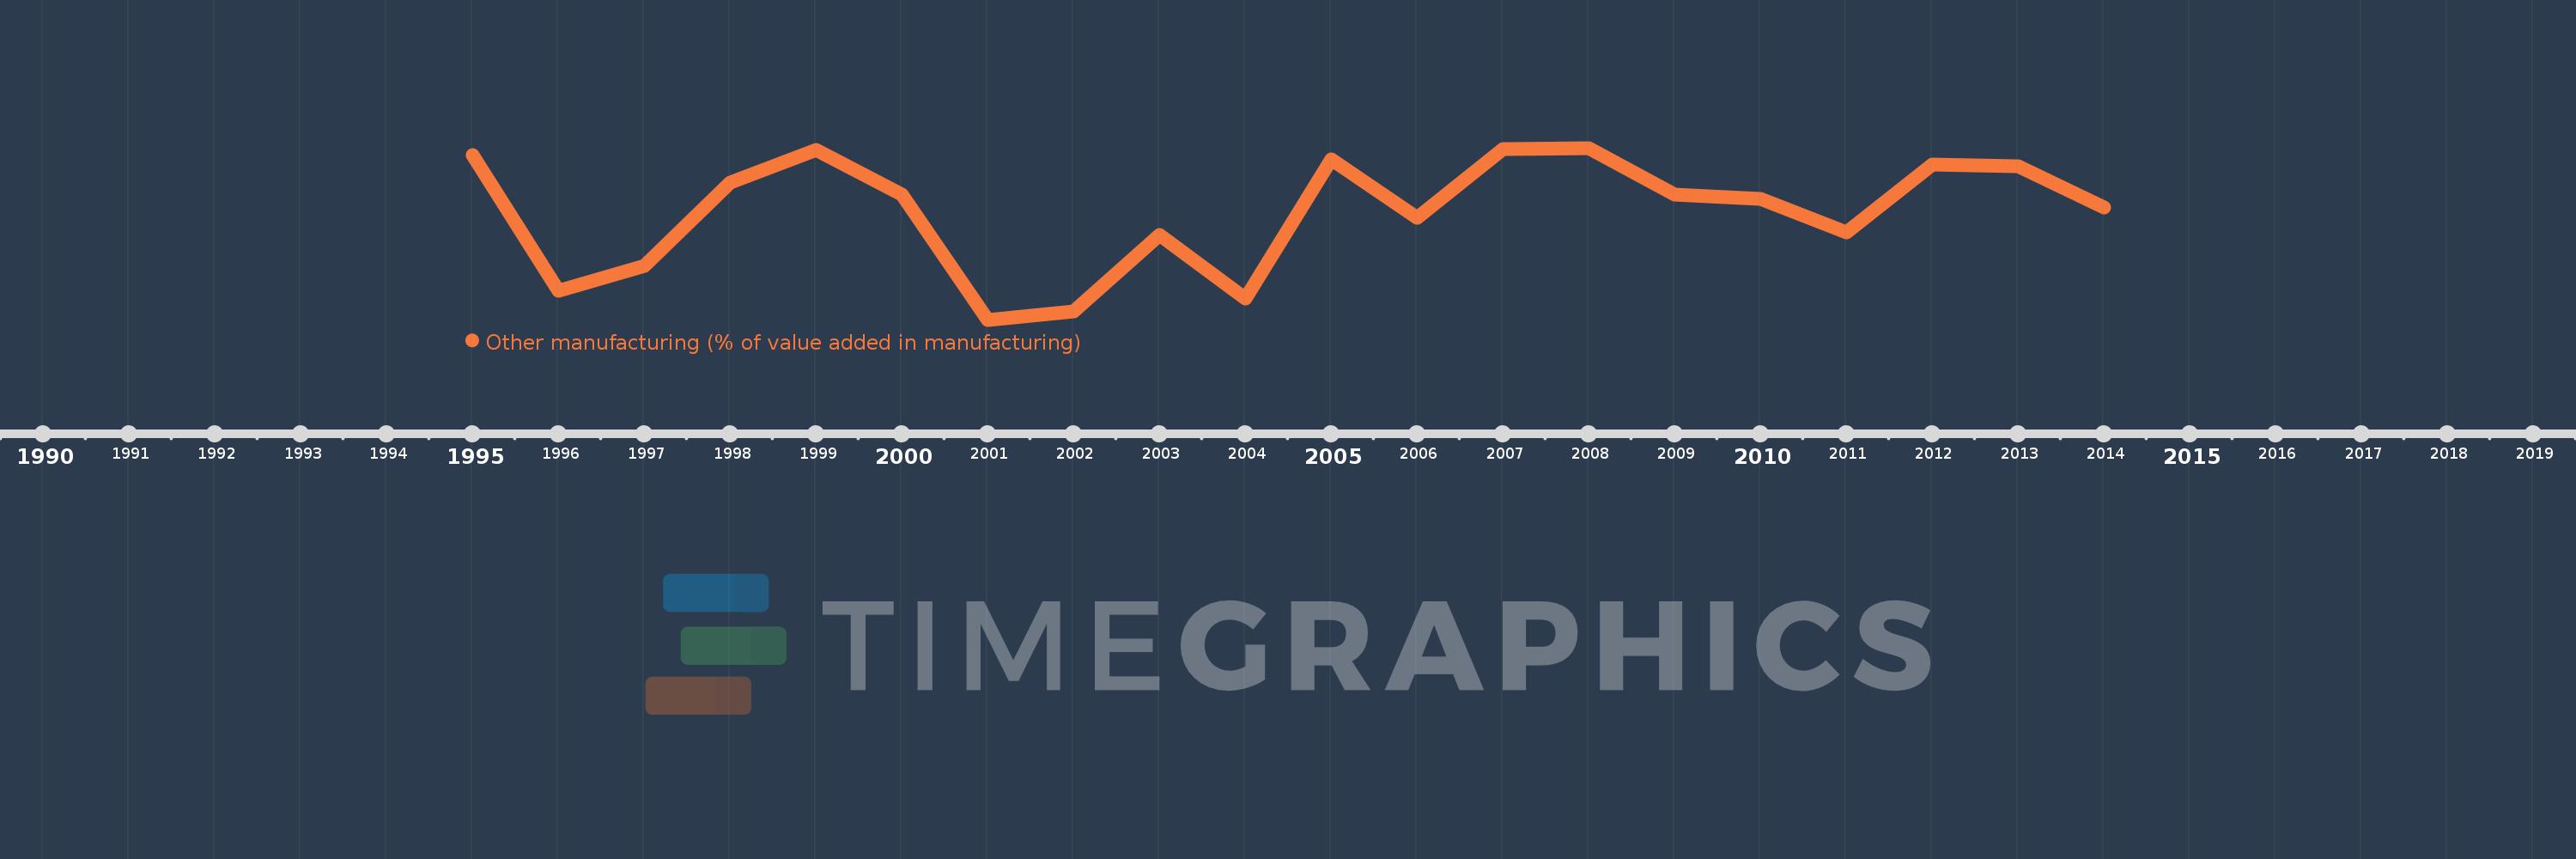
Other manufacturing (% of value added in manufacturing)
2014,2013,2012,2011,2010,2009,2008,2007,2006,2005,2004,2003,2002,2001,2000,1999,1998,1997,1996,1995
This statistics in other country:
AlbaniaAlgeriaArgentinaAustraliaAustriaAzerbaijanBahamas, TheBahrainBangladeshBarbadosBelarusBelgiumBelizeBeninBoliviaBosnia and HerzegovinaBotswanaBrazilBulgariaBurkina FasoBurundiCambodiaCameroonCanadaCentral African RepublicChileChinaColombiaCongo, Rep.Costa RicaCote d'IvoireCroatiaCubaCyprusCzech RepublicDenmarkDominican RepublicEcuadorEgypt, Arab Rep.El SalvadorEritreaEstoniaEthiopiaFijiFinlandFranceGabonGambia, TheGeorgiaGermanyGhanaGreeceGuatemalaHondurasHong Kong SAR, ChinaHungaryIcelandIndiaIndonesiaIran, Islamic Rep.IraqIrelandIsraelItalyJamaicaJapanJordanKazakhstanKenyaKorea, Rep.KuwaitKyrgyz RepublicLao PDRLatviaLebanonLesothoLibyaLithuaniaLuxembourgMacao SAR, ChinaMacedonia, FYRMadagascarMalawiMalaysiaMaltaMauritiusMexicoMoldovaMongoliaMoroccoMozambiqueNamibiaNepalNetherlandsNew ZealandNicaraguaNigerNigeriaNorwayOmanPakistanPanamaPapua New GuineaParaguayPeruPhilippinesPolandPortugalPuerto RicoQatarRomaniaRussian FederationRwandaSaudi ArabiaSenegalSerbiaSierra LeoneSingaporeSlovak RepublicSloveniaSomaliaSouth AfricaSpainSri LankaSt. LuciaSudanSwazilandSwedenSwitzerlandSyrian Arab RepublicTanzaniaThailandTongaTrinidad and TobagoTunisiaTurkeyUgandaUkraineUnited Arab EmiratesUnited KingdomUnited StatesUruguayVenezuela, RBVietnamWest Bank and GazaYemen, Rep.Zambia Timeline:
This timeline shows a graph from 1995 to 2014 of West Bank and Gaza. No data until 1994. Number of actual observations by date: 20.
Source name:
World Development Indicators
Source organization:
United Nations Industrial Development Organization, International Yearbook of Industrial Statistics.
Categories, topics:
Economy & Growth
Last updated:
apr 23, 2017
Indicators value changes by year
Minimum:
41.483
jan 1, 2001
Maximum:
55.474
jan 1, 2008
At the date of observation
Value
Absolute change
Change from previous value
jan 1, 1995
54.928
+54.928
0.0%
jan 1, 1996
43.816
-11.112
-20.23%
jan 1, 1997
45.903
+2.086
4.76%
jan 1, 1998
52.628
+6.726
14.65%
jan 1, 1999
55.298
+2.67
5.07%
jan 1, 2000
51.674
-3.624
-6.55%
jan 1, 2001
41.483
-10.191
-19.72%
jan 1, 2002
42.143
+0.66
1.59%
jan 1, 2003
48.365
+6.222
14.76%
jan 1, 2004
43.177
-5.188
-10.73%
jan 1, 2005
54.569
+11.392
26.38%
jan 1, 2006
49.795
-4.775
-8.75%
jan 1, 2007
55.389
+5.594
11.23%
jan 1, 2008
55.474
+0.085
0.15%
jan 1, 2009
51.695
-3.78
-6.81%
jan 1, 2010
51.352
-0.343
-0.66%
jan 1, 2011
48.572
-2.78
-5.41%
jan 1, 2012
54.099
+5.526
11.38%
jan 1, 2013
53.994
-0.105
-0.19%
jan 1, 2014
50.634
-3.36
-6.22%
Ranking of countries by current statistics by years


Comments: