29
/
en
AIzaSyAYiBZKx7MnpbEhh9jyipgxe19OcubqV5w
April 1, 2024
257651
Switzerland
CHE
true
2
1
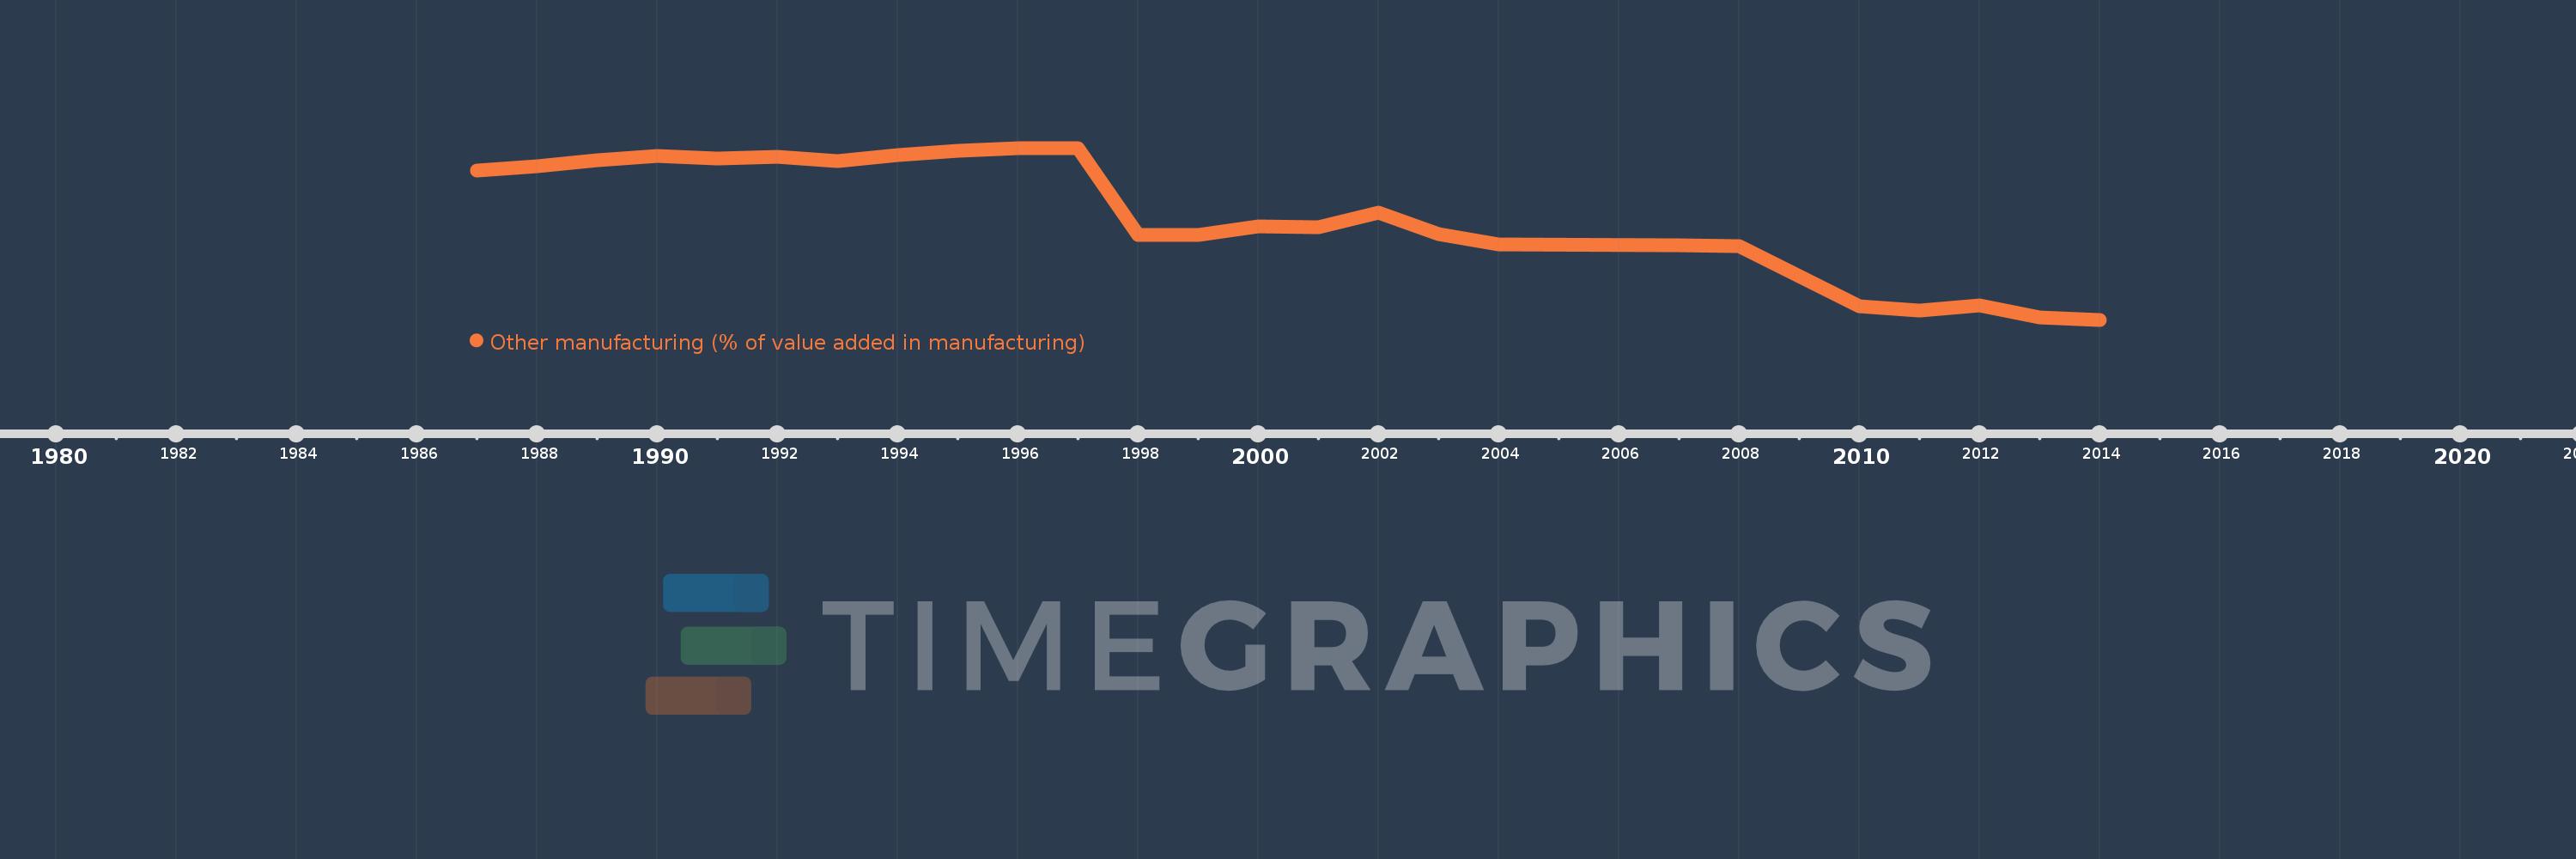
Other manufacturing (% of value added in manufacturing)
2014,2013,2012,2011,2010,2008,2007,2004,2003,2002,2001,2000,1999,1998,1997,1996,1995,1994,1993,1992,1991,1990,1989,1988,1987
This statistics in other country:
AlbaniaAlgeriaArgentinaAustraliaAustriaAzerbaijanBahamas, TheBahrainBangladeshBarbadosBelarusBelgiumBelizeBeninBoliviaBosnia and HerzegovinaBotswanaBrazilBulgariaBurkina FasoBurundiCambodiaCameroonCanadaCentral African RepublicChileChinaColombiaCongo, Rep.Costa RicaCote d'IvoireCroatiaCubaCyprusCzech RepublicDenmarkDominican RepublicEcuadorEgypt, Arab Rep.El SalvadorEritreaEstoniaEthiopiaFijiFinlandFranceGabonGambia, TheGeorgiaGermanyGhanaGreeceGuatemalaHondurasHong Kong SAR, ChinaHungaryIcelandIndiaIndonesiaIran, Islamic Rep.IraqIrelandIsraelItalyJamaicaJapanJordanKazakhstanKenyaKorea, Rep.KuwaitKyrgyz RepublicLao PDRLatviaLebanonLesothoLibyaLithuaniaLuxembourgMacao SAR, ChinaMacedonia, FYRMadagascarMalawiMalaysiaMaltaMauritiusMexicoMoldovaMongoliaMoroccoMozambiqueNamibiaNepalNetherlandsNew ZealandNicaraguaNigerNigeriaNorwayOmanPakistanPanamaPapua New GuineaParaguayPeruPhilippinesPolandPortugalPuerto RicoQatarRomaniaRussian FederationRwandaSaudi ArabiaSenegalSerbiaSierra LeoneSingaporeSlovak RepublicSloveniaSomaliaSouth AfricaSpainSri LankaSt. LuciaSudanSwazilandSwedenSwitzerlandSyrian Arab RepublicTanzaniaThailandTongaTrinidad and TobagoTunisiaTurkeyUgandaUkraineUnited Arab EmiratesUnited KingdomUnited StatesUruguayVenezuela, RBVietnamWest Bank and GazaYemen, Rep.Zambia Timeline:
This timeline shows a graph from 1987 to 2014 of Switzerland. No data until 1986. Number of actual observations by date: 25.
Source name:
World Development Indicators
Source organization:
United Nations Industrial Development Organization, International Yearbook of Industrial Statistics.
Categories, topics:
Economy & Growth
Last updated:
apr 23, 2017
Indicators value changes by year
Minimum:
32.536
jan 1, 2014
Maximum:
71.423
jan 1, 1996
At the date of observation
Value
Absolute change
Change from previous value
jan 1, 1987
66.348
+66.348
0.0%
jan 1, 1988
67.332
+0.984
1.48%
jan 1, 1989
68.738
+1.406
2.09%
jan 1, 1990
69.671
+0.933
1.36%
jan 1, 1991
68.941
-0.73
-1.05%
jan 1, 1992
69.465
+0.524
0.76%
jan 1, 1993
68.54
-0.924
-1.33%
jan 1, 1994
69.768
+1.228
1.79%
jan 1, 1995
70.737
+0.969
1.39%
jan 1, 1996
71.423
+0.686
0.97%
jan 1, 1997
71.284
-0.139
-0.19%
jan 1, 1998
51.68
-19.604
-27.5%
jan 1, 1999
51.653
-0.027
-0.05%
jan 1, 2000
53.711
+2.057
3.98%
jan 1, 2001
53.557
-0.154
-0.29%
jan 1, 2002
56.856
+3.299
6.16%
jan 1, 2003
51.935
-4.921
-8.66%
jan 1, 2004
49.621
-2.314
-4.46%
jan 1, 2007
49.482
-0.138
-0.28%
jan 1, 2008
49.257
-0.225
-0.46%
jan 1, 2010
35.64
-13.617
-27.64%
jan 1, 2011
34.677
-0.963
-2.7%
jan 1, 2012
35.728
+1.05
3.03%
jan 1, 2013
32.969
-2.758
-7.72%
jan 1, 2014
32.536
-0.433
-1.31%
Ranking of countries by current statistics by years


Comments: