29
/
en
AIzaSyAYiBZKx7MnpbEhh9jyipgxe19OcubqV5w
April 1, 2024
144833
Guatemala
GTM
true
2
1
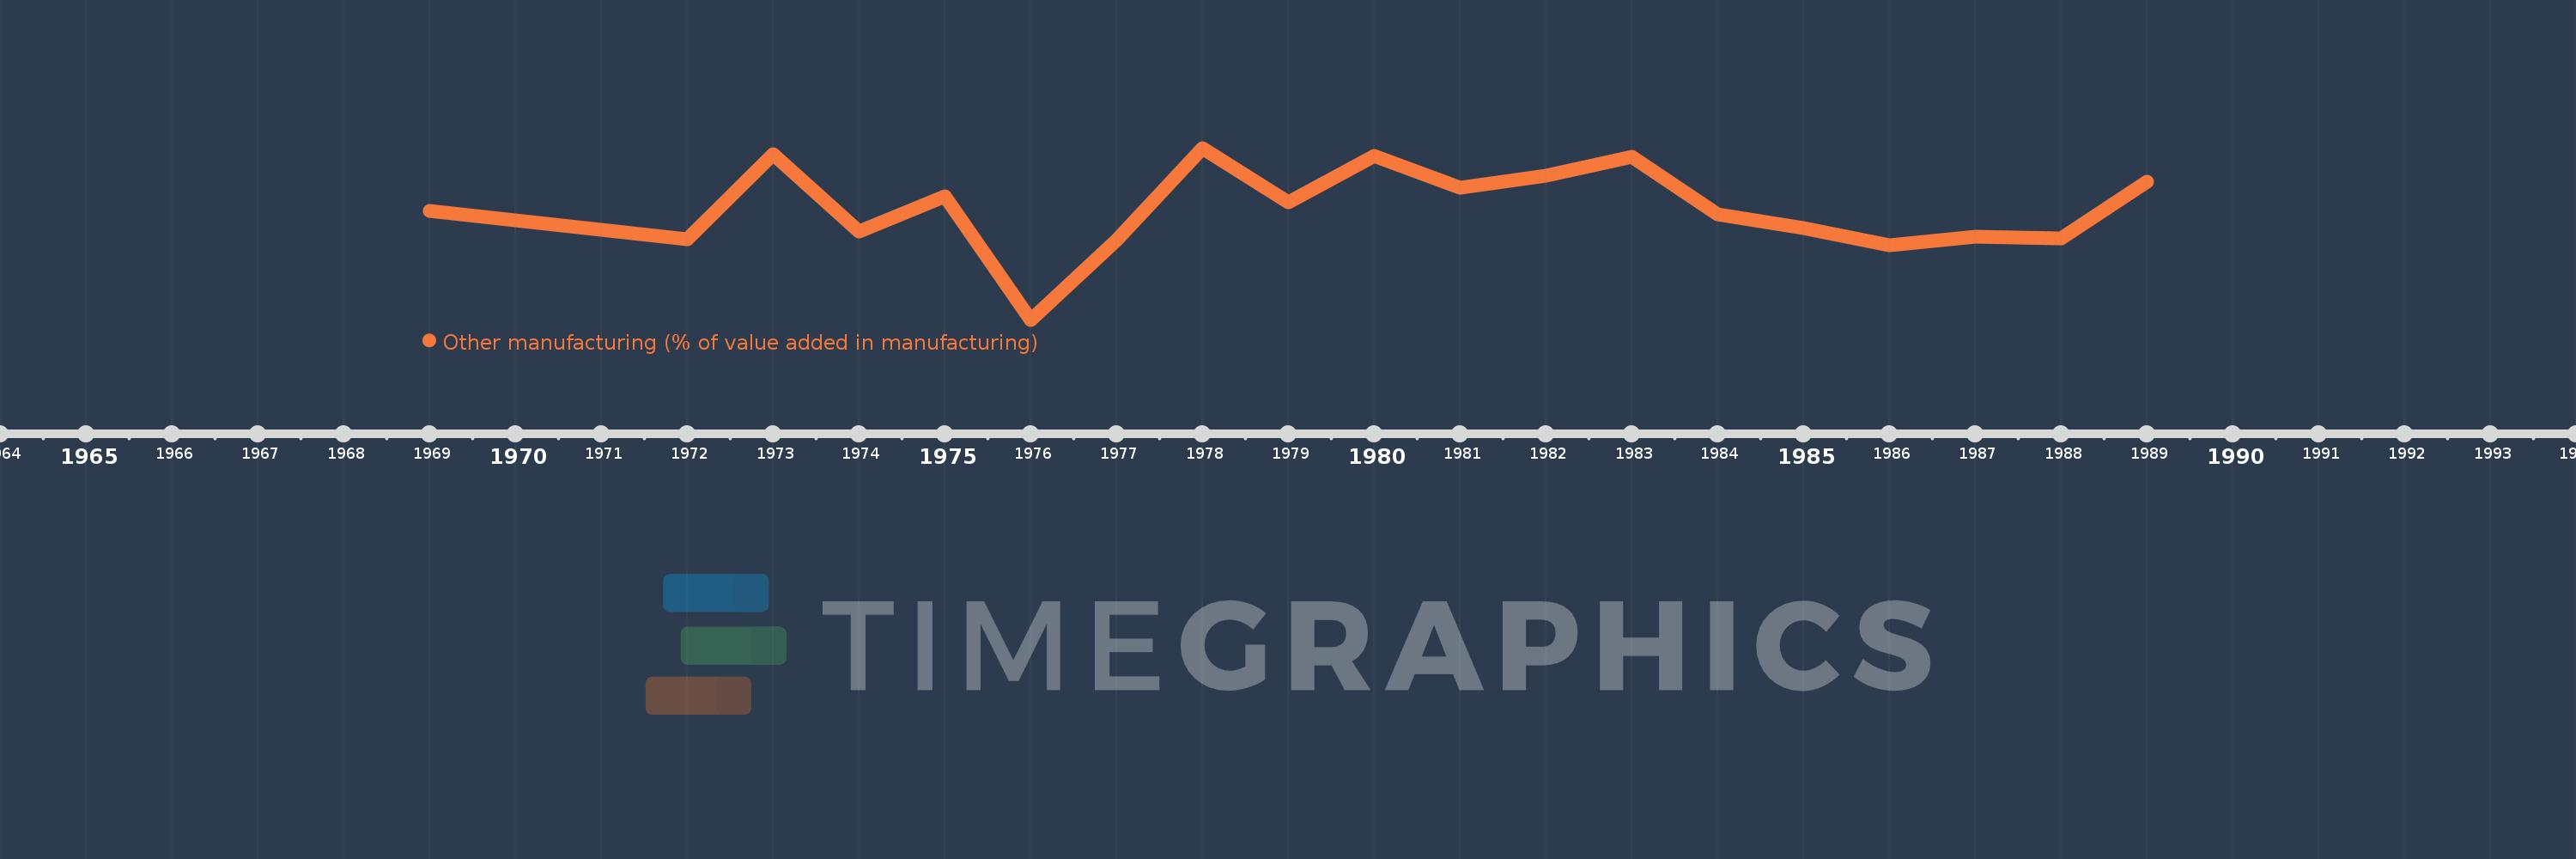
Other manufacturing (% of value added in manufacturing)
1989,1988,1987,1986,1985,1984,1983,1982,1981,1980,1979,1978,1977,1976,1975,1974,1973,1972,1969
This statistics in other country:
AlbaniaAlgeriaArgentinaAustraliaAustriaAzerbaijanBahamas, TheBahrainBangladeshBarbadosBelarusBelgiumBelizeBeninBoliviaBosnia and HerzegovinaBotswanaBrazilBulgariaBurkina FasoBurundiCambodiaCameroonCanadaCentral African RepublicChileChinaColombiaCongo, Rep.Costa RicaCote d'IvoireCroatiaCubaCyprusCzech RepublicDenmarkDominican RepublicEcuadorEgypt, Arab Rep.El SalvadorEritreaEstoniaEthiopiaFijiFinlandFranceGabonGambia, TheGeorgiaGermanyGhanaGreeceGuatemalaHondurasHong Kong SAR, ChinaHungaryIcelandIndiaIndonesiaIran, Islamic Rep.IraqIrelandIsraelItalyJamaicaJapanJordanKazakhstanKenyaKorea, Rep.KuwaitKyrgyz RepublicLao PDRLatviaLebanonLesothoLibyaLithuaniaLuxembourgMacao SAR, ChinaMacedonia, FYRMadagascarMalawiMalaysiaMaltaMauritiusMexicoMoldovaMongoliaMoroccoMozambiqueNamibiaNepalNetherlandsNew ZealandNicaraguaNigerNigeriaNorwayOmanPakistanPanamaPapua New GuineaParaguayPeruPhilippinesPolandPortugalPuerto RicoQatarRomaniaRussian FederationRwandaSaudi ArabiaSenegalSerbiaSierra LeoneSingaporeSlovak RepublicSloveniaSomaliaSouth AfricaSpainSri LankaSt. LuciaSudanSwazilandSwedenSwitzerlandSyrian Arab RepublicTanzaniaThailandTongaTrinidad and TobagoTunisiaTurkeyUgandaUkraineUnited Arab EmiratesUnited KingdomUnited StatesUruguayVenezuela, RBVietnamWest Bank and GazaYemen, Rep.Zambia Timeline:
This timeline shows a graph from 1969 to 1989 of Guatemala. No data until 1968. Number of actual observations by date: 19.
Source name:
World Development Indicators
Source organization:
United Nations Industrial Development Organization, International Yearbook of Industrial Statistics.
Categories, topics:
Economy & Growth
Last updated:
apr 23, 2017
Indicators value changes by year
Minimum:
27.464
jan 1, 1976
Maximum:
32.881
jan 1, 1978
At the date of observation
Value
Absolute change
Change from previous value
jan 1, 1969
30.906
+30.906
0.0%
jan 1, 1972
29.998
-0.908
-2.94%
jan 1, 1973
32.687
+2.689
8.96%
jan 1, 1974
30.249
-2.438
-7.46%
jan 1, 1975
31.346
+1.097
3.63%
jan 1, 1976
27.464
-3.882
-12.39%
jan 1, 1977
29.988
+2.524
9.19%
jan 1, 1978
32.881
+2.893
9.65%
jan 1, 1979
31.161
-1.72
-5.23%
jan 1, 1980
32.629
+1.468
4.71%
jan 1, 1981
31.638
-0.991
-3.04%
jan 1, 1982
32.004
+0.367
1.16%
jan 1, 1983
32.609
+0.605
1.89%
jan 1, 1984
30.777
-1.833
-5.62%
jan 1, 1985
30.356
-0.42
-1.37%
jan 1, 1986
29.81
-0.546
-1.8%
jan 1, 1987
30.09
+0.28
0.94%
jan 1, 1988
30.034
-0.056
-0.19%
jan 1, 1989
31.812
+1.778
5.92%
Ranking of countries by current statistics by years


Comments: