29
/
en
AIzaSyAYiBZKx7MnpbEhh9jyipgxe19OcubqV5w
April 1, 2024
184319
Macedonia, FYR
MKD
true
2
1
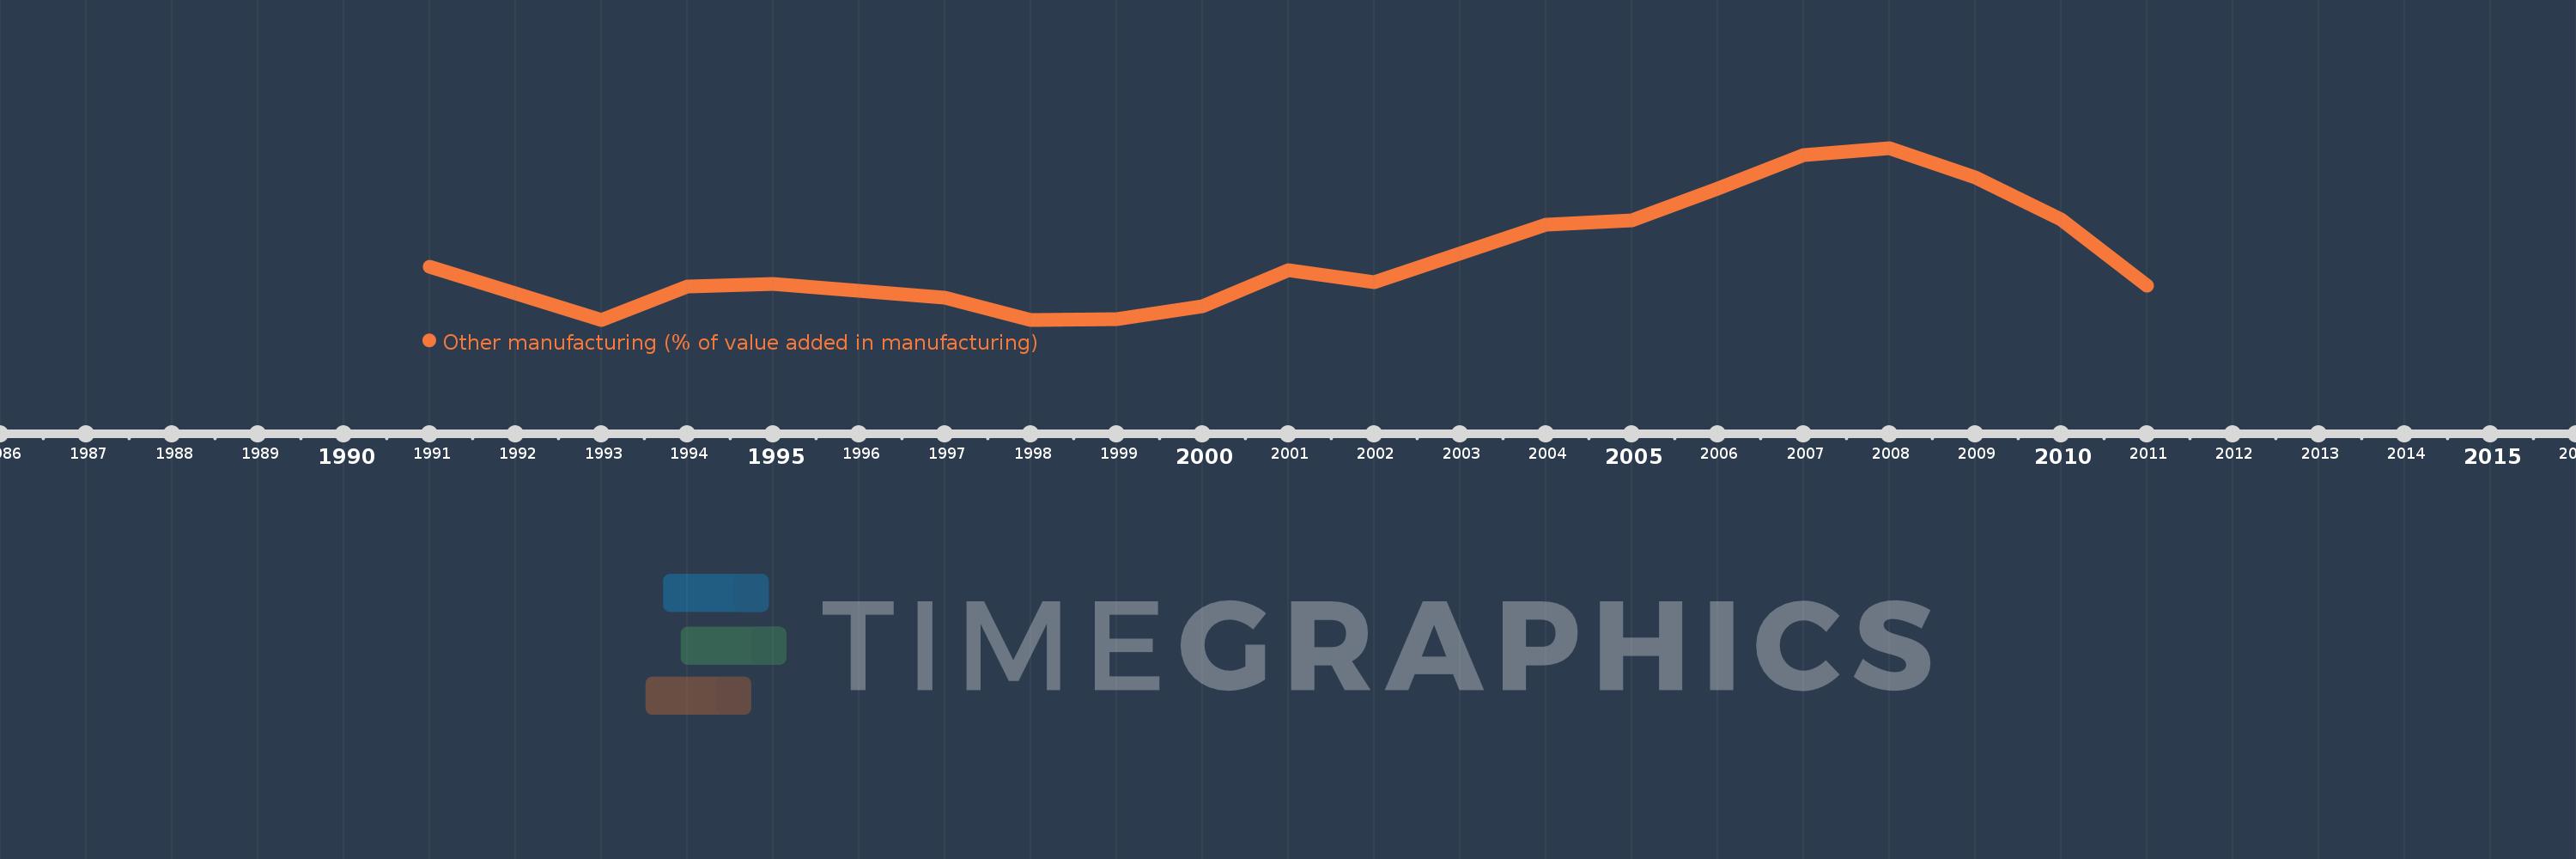
Other manufacturing (% of value added in manufacturing)
2011,2010,2009,2008,2007,2006,2005,2004,2002,2001,2000,1999,1998,1997,1996,1995,1994,1993,1992,1991
This statistics in other country:
AlbaniaAlgeriaArgentinaAustraliaAustriaAzerbaijanBahamas, TheBahrainBangladeshBarbadosBelarusBelgiumBelizeBeninBoliviaBosnia and HerzegovinaBotswanaBrazilBulgariaBurkina FasoBurundiCambodiaCameroonCanadaCentral African RepublicChileChinaColombiaCongo, Rep.Costa RicaCote d'IvoireCroatiaCubaCyprusCzech RepublicDenmarkDominican RepublicEcuadorEgypt, Arab Rep.El SalvadorEritreaEstoniaEthiopiaFijiFinlandFranceGabonGambia, TheGeorgiaGermanyGhanaGreeceGuatemalaHondurasHong Kong SAR, ChinaHungaryIcelandIndiaIndonesiaIran, Islamic Rep.IraqIrelandIsraelItalyJamaicaJapanJordanKazakhstanKenyaKorea, Rep.KuwaitKyrgyz RepublicLao PDRLatviaLebanonLesothoLibyaLithuaniaLuxembourgMacao SAR, ChinaMacedonia, FYRMadagascarMalawiMalaysiaMaltaMauritiusMexicoMoldovaMongoliaMoroccoMozambiqueNamibiaNepalNetherlandsNew ZealandNicaraguaNigerNigeriaNorwayOmanPakistanPanamaPapua New GuineaParaguayPeruPhilippinesPolandPortugalPuerto RicoQatarRomaniaRussian FederationRwandaSaudi ArabiaSenegalSerbiaSierra LeoneSingaporeSlovak RepublicSloveniaSomaliaSouth AfricaSpainSri LankaSt. LuciaSudanSwazilandSwedenSwitzerlandSyrian Arab RepublicTanzaniaThailandTongaTrinidad and TobagoTunisiaTurkeyUgandaUkraineUnited Arab EmiratesUnited KingdomUnited StatesUruguayVenezuela, RBVietnamWest Bank and GazaYemen, Rep.Zambia Timeline:
This timeline shows a graph from 1991 to 2011 of Macedonia, FYR. No data until 1990. Number of actual observations by date: 20.
Source name:
World Development Indicators
Source organization:
United Nations Industrial Development Organization, International Yearbook of Industrial Statistics.
Categories, topics:
Economy & Growth
Last updated:
apr 23, 2017
Indicators value changes by year
Minimum:
30.771
jan 1, 1998
Maximum:
55.213
jan 1, 2008
At the date of observation
Value
Absolute change
Change from previous value
jan 1, 1991
38.362
+38.362
0.0%
jan 1, 1992
34.561
-3.801
-9.91%
jan 1, 1993
30.794
-3.767
-10.9%
jan 1, 1994
35.454
+4.66
15.13%
jan 1, 1995
35.831
+0.377
1.06%
jan 1, 1996
34.834
-0.997
-2.78%
jan 1, 1997
33.957
-0.877
-2.52%
jan 1, 1998
30.771
-3.187
-9.38%
jan 1, 1999
30.808
+0.037
0.12%
jan 1, 2000
32.686
+1.878
6.1%
jan 1, 2001
37.845
+5.159
15.78%
jan 1, 2002
36.102
-1.743
-4.61%
jan 1, 2004
44.278
+8.176
22.65%
jan 1, 2005
44.962
+0.684
1.55%
jan 1, 2006
49.468
+4.505
10.02%
jan 1, 2007
54.157
+4.69
9.48%
jan 1, 2008
55.213
+1.056
1.95%
jan 1, 2009
50.968
-4.245
-7.69%
jan 1, 2010
45.067
-5.902
-11.58%
jan 1, 2011
35.562
-9.505
-21.09%
Ranking of countries by current statistics by years


Comments: