29
/
en
AIzaSyAYiBZKx7MnpbEhh9jyipgxe19OcubqV5w
April 1, 2024
242981
Slovenia
SVN
true
2
1
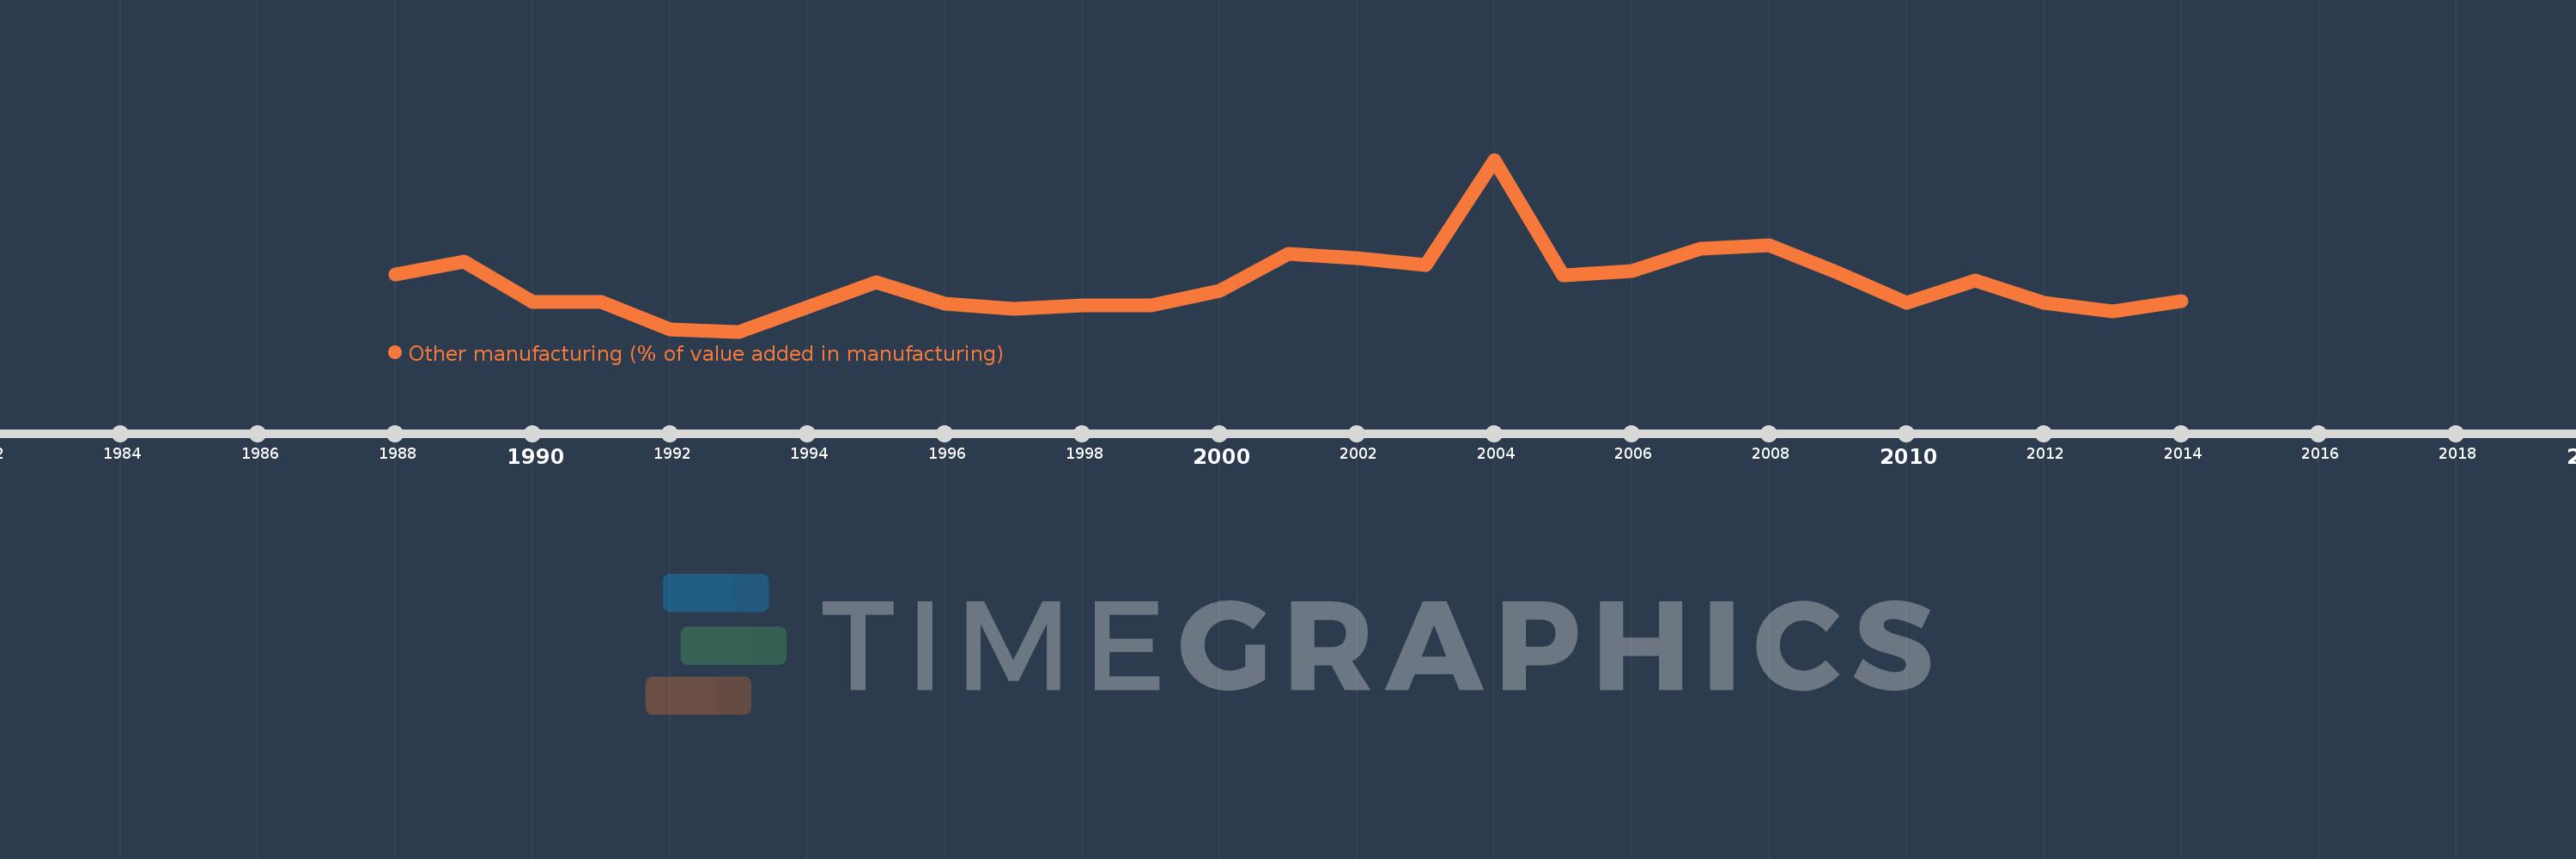
Other manufacturing (% of value added in manufacturing)
2014,2013,2012,2011,2010,2009,2008,2007,2006,2005,2004,2003,2002,2001,2000,1999,1998,1997,1996,1995,1994,1993,1992,1991,1990,1989,1988
This statistics in other country:
AlbaniaAlgeriaArgentinaAustraliaAustriaAzerbaijanBahamas, TheBahrainBangladeshBarbadosBelarusBelgiumBelizeBeninBoliviaBosnia and HerzegovinaBotswanaBrazilBulgariaBurkina FasoBurundiCambodiaCameroonCanadaCentral African RepublicChileChinaColombiaCongo, Rep.Costa RicaCote d'IvoireCroatiaCubaCyprusCzech RepublicDenmarkDominican RepublicEcuadorEgypt, Arab Rep.El SalvadorEritreaEstoniaEthiopiaFijiFinlandFranceGabonGambia, TheGeorgiaGermanyGhanaGreeceGuatemalaHondurasHong Kong SAR, ChinaHungaryIcelandIndiaIndonesiaIran, Islamic Rep.IraqIrelandIsraelItalyJamaicaJapanJordanKazakhstanKenyaKorea, Rep.KuwaitKyrgyz RepublicLao PDRLatviaLebanonLesothoLibyaLithuaniaLuxembourgMacao SAR, ChinaMacedonia, FYRMadagascarMalawiMalaysiaMaltaMauritiusMexicoMoldovaMongoliaMoroccoMozambiqueNamibiaNepalNetherlandsNew ZealandNicaraguaNigerNigeriaNorwayOmanPakistanPanamaPapua New GuineaParaguayPeruPhilippinesPolandPortugalPuerto RicoQatarRomaniaRussian FederationRwandaSaudi ArabiaSenegalSerbiaSierra LeoneSingaporeSlovak RepublicSloveniaSomaliaSouth AfricaSpainSri LankaSt. LuciaSudanSwazilandSwedenSwitzerlandSyrian Arab RepublicTanzaniaThailandTongaTrinidad and TobagoTunisiaTurkeyUgandaUkraineUnited Arab EmiratesUnited KingdomUnited StatesUruguayVenezuela, RBVietnamWest Bank and GazaYemen, Rep.Zambia Timeline:
This timeline shows a graph from 1988 to 2014 of Slovenia. No data until 1987. Number of actual observations by date: 27.
Source name:
World Development Indicators
Source organization:
United Nations Industrial Development Organization, International Yearbook of Industrial Statistics.
Categories, topics:
Economy & Growth
Last updated:
apr 23, 2017
Indicators value changes by year
Minimum:
48.675
jan 1, 1993
Maximum:
60.065
jan 1, 2004
At the date of observation
Value
Absolute change
Change from previous value
jan 1, 1988
52.484
+52.484
0.0%
jan 1, 1989
53.344
+0.86
1.64%
jan 1, 1990
50.628
-2.716
-5.09%
jan 1, 1991
50.647
+0.019
0.04%
jan 1, 1992
48.789
-1.858
-3.67%
jan 1, 1993
48.675
-0.114
-0.23%
jan 1, 1994
50.311
+1.635
3.36%
jan 1, 1995
51.96
+1.65
3.28%
jan 1, 1996
50.527
-1.433
-2.76%
jan 1, 1997
50.194
-0.333
-0.66%
jan 1, 1998
50.387
+0.193
0.38%
jan 1, 1999
50.397
+0.011
0.02%
jan 1, 2000
51.386
+0.989
1.96%
jan 1, 2001
53.841
+2.455
4.78%
jan 1, 2002
53.527
-0.314
-0.58%
jan 1, 2003
53.065
-0.462
-0.86%
jan 1, 2004
60.065
+7.0
13.19%
jan 1, 2005
52.416
-7.649
-12.73%
jan 1, 2006
52.711
+0.295
0.56%
jan 1, 2007
54.172
+1.462
2.77%
jan 1, 2008
54.396
+0.224
0.41%
jan 1, 2009
52.592
-1.804
-3.32%
jan 1, 2010
50.573
-2.019
-3.84%
jan 1, 2011
52.044
+1.471
2.91%
jan 1, 2012
50.577
-1.467
-2.82%
jan 1, 2013
50.041
-0.536
-1.06%
jan 1, 2014
50.723
+0.683
1.36%
Ranking of countries by current statistics by years


Comments: