29
/
en
AIzaSyAYiBZKx7MnpbEhh9jyipgxe19OcubqV5w
April 1, 2024
198008
Moldova
MDA
true
2
1
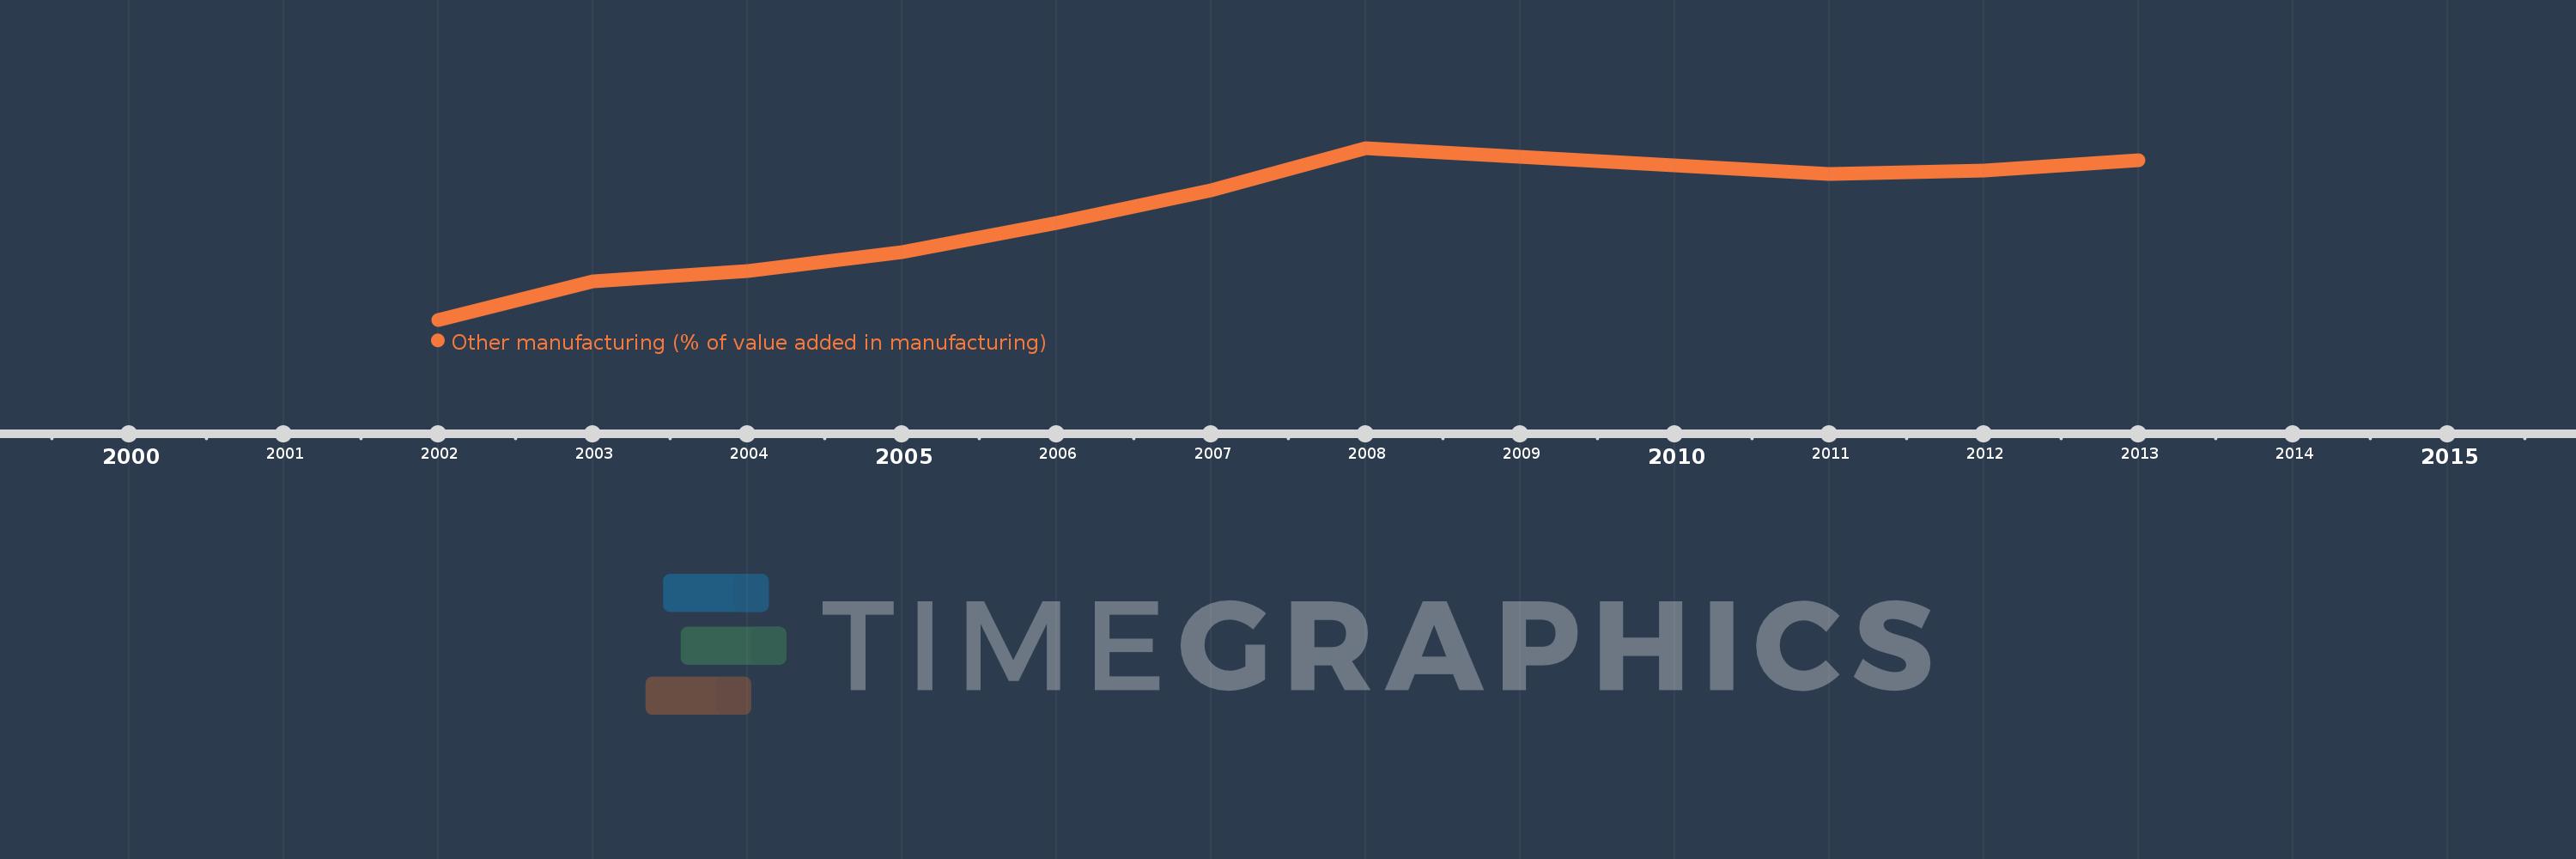
Other manufacturing (% of value added in manufacturing)
2013,2012,2011,2010,2009,2008,2007,2006,2005,2004,2003,2002
This statistics in other country:
AlbaniaAlgeriaArgentinaAustraliaAustriaAzerbaijanBahamas, TheBahrainBangladeshBarbadosBelarusBelgiumBelizeBeninBoliviaBosnia and HerzegovinaBotswanaBrazilBulgariaBurkina FasoBurundiCambodiaCameroonCanadaCentral African RepublicChileChinaColombiaCongo, Rep.Costa RicaCote d'IvoireCroatiaCubaCyprusCzech RepublicDenmarkDominican RepublicEcuadorEgypt, Arab Rep.El SalvadorEritreaEstoniaEthiopiaFijiFinlandFranceGabonGambia, TheGeorgiaGermanyGhanaGreeceGuatemalaHondurasHong Kong SAR, ChinaHungaryIcelandIndiaIndonesiaIran, Islamic Rep.IraqIrelandIsraelItalyJamaicaJapanJordanKazakhstanKenyaKorea, Rep.KuwaitKyrgyz RepublicLao PDRLatviaLebanonLesothoLibyaLithuaniaLuxembourgMacao SAR, ChinaMacedonia, FYRMadagascarMalawiMalaysiaMaltaMauritiusMexicoMoldovaMongoliaMoroccoMozambiqueNamibiaNepalNetherlandsNew ZealandNicaraguaNigerNigeriaNorwayOmanPakistanPanamaPapua New GuineaParaguayPeruPhilippinesPolandPortugalPuerto RicoQatarRomaniaRussian FederationRwandaSaudi ArabiaSenegalSerbiaSierra LeoneSingaporeSlovak RepublicSloveniaSomaliaSouth AfricaSpainSri LankaSt. LuciaSudanSwazilandSwedenSwitzerlandSyrian Arab RepublicTanzaniaThailandTongaTrinidad and TobagoTunisiaTurkeyUgandaUkraineUnited Arab EmiratesUnited KingdomUnited StatesUruguayVenezuela, RBVietnamWest Bank and GazaYemen, Rep.Zambia Timeline:
This timeline shows a graph from 2002 to 2013 of Moldova. No data until 2001. Number of actual observations by date: 12.
Source name:
World Development Indicators
Source organization:
United Nations Industrial Development Organization, International Yearbook of Industrial Statistics.
Categories, topics:
Economy & Growth
Last updated:
apr 23, 2017
Indicators value changes by year
Minimum:
21.795
jan 1, 2002
Maximum:
41.798
jan 1, 2008
At the date of observation
Value
Absolute change
Change from previous value
jan 1, 2002
21.795
+21.795
0.0%
jan 1, 2003
26.238
+4.443
20.38%
jan 1, 2004
27.43
+1.192
4.54%
jan 1, 2005
29.7
+2.27
8.28%
jan 1, 2006
33.039
+3.339
11.24%
jan 1, 2007
36.903
+3.864
11.69%
jan 1, 2008
41.798
+4.895
13.26%
jan 1, 2009
40.742
-1.057
-2.53%
jan 1, 2010
39.736
-1.005
-2.47%
jan 1, 2011
38.794
-0.942
-2.37%
jan 1, 2012
39.199
+0.405
1.04%
jan 1, 2013
40.352
+1.152
2.94%
Ranking of countries by current statistics by years


Comments: