29
/
en
AIzaSyAYiBZKx7MnpbEhh9jyipgxe19OcubqV5w
April 1, 2024
228928
Romania
ROU
true
2
1
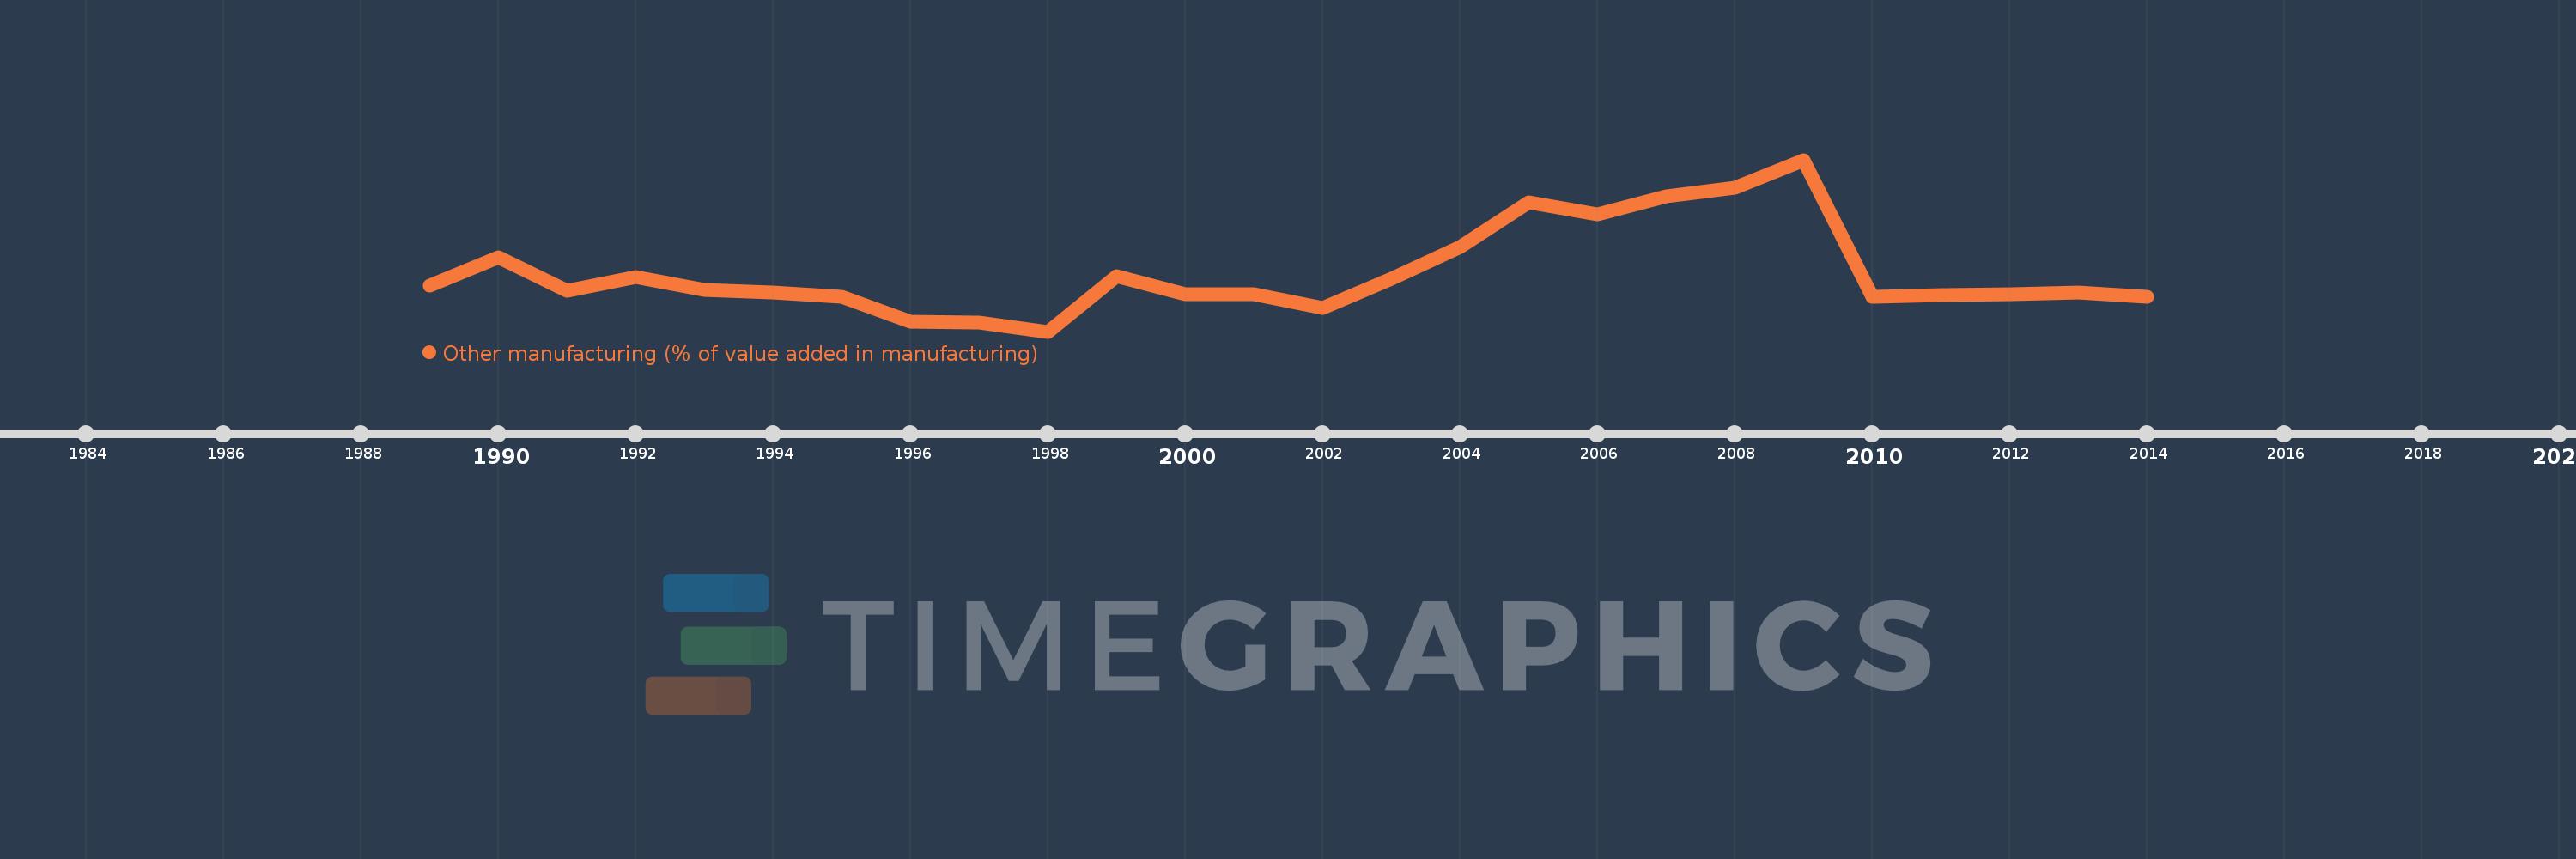
Other manufacturing (% of value added in manufacturing)
2014,2013,2012,2011,2010,2009,2008,2007,2006,2005,2004,2003,2002,2001,2000,1999,1998,1997,1996,1995,1994,1993,1992,1991,1990,1989
This statistics in other country:
AlbaniaAlgeriaArgentinaAustraliaAustriaAzerbaijanBahamas, TheBahrainBangladeshBarbadosBelarusBelgiumBelizeBeninBoliviaBosnia and HerzegovinaBotswanaBrazilBulgariaBurkina FasoBurundiCambodiaCameroonCanadaCentral African RepublicChileChinaColombiaCongo, Rep.Costa RicaCote d'IvoireCroatiaCubaCyprusCzech RepublicDenmarkDominican RepublicEcuadorEgypt, Arab Rep.El SalvadorEritreaEstoniaEthiopiaFijiFinlandFranceGabonGambia, TheGeorgiaGermanyGhanaGreeceGuatemalaHondurasHong Kong SAR, ChinaHungaryIcelandIndiaIndonesiaIran, Islamic Rep.IraqIrelandIsraelItalyJamaicaJapanJordanKazakhstanKenyaKorea, Rep.KuwaitKyrgyz RepublicLao PDRLatviaLebanonLesothoLibyaLithuaniaLuxembourgMacao SAR, ChinaMacedonia, FYRMadagascarMalawiMalaysiaMaltaMauritiusMexicoMoldovaMongoliaMoroccoMozambiqueNamibiaNepalNetherlandsNew ZealandNicaraguaNigerNigeriaNorwayOmanPakistanPanamaPapua New GuineaParaguayPeruPhilippinesPolandPortugalPuerto RicoQatarRomaniaRussian FederationRwandaSaudi ArabiaSenegalSerbiaSierra LeoneSingaporeSlovak RepublicSloveniaSomaliaSouth AfricaSpainSri LankaSt. LuciaSudanSwazilandSwedenSwitzerlandSyrian Arab RepublicTanzaniaThailandTongaTrinidad and TobagoTunisiaTurkeyUgandaUkraineUnited Arab EmiratesUnited KingdomUnited StatesUruguayVenezuela, RBVietnamWest Bank and GazaYemen, Rep.Zambia Timeline:
This timeline shows a graph from 1989 to 2014 of Romania. No data until 1988. Number of actual observations by date: 26.
Source name:
World Development Indicators
Source organization:
United Nations Industrial Development Organization, International Yearbook of Industrial Statistics.
Categories, topics:
Economy & Growth
Last updated:
apr 23, 2017
Indicators value changes by year
Minimum:
34.367
jan 1, 1998
Maximum:
51.264
jan 1, 2009
At the date of observation
Value
Absolute change
Change from previous value
jan 1, 1989
38.857
+38.857
0.0%
jan 1, 1990
41.634
+2.777
7.15%
jan 1, 1991
38.42
-3.214
-7.72%
jan 1, 1992
39.774
+1.354
3.52%
jan 1, 1993
38.438
-1.336
-3.36%
jan 1, 1994
38.193
-0.245
-0.64%
jan 1, 1995
37.765
-0.428
-1.12%
jan 1, 1996
35.3
-2.465
-6.53%
jan 1, 1997
35.226
-0.075
-0.21%
jan 1, 1998
34.367
-0.859
-2.44%
jan 1, 1999
39.796
+5.429
15.8%
jan 1, 2000
38.052
-1.745
-4.38%
jan 1, 2001
38.025
-0.027
-0.07%
jan 1, 2002
36.676
-1.349
-3.55%
jan 1, 2003
39.569
+2.893
7.89%
jan 1, 2004
42.698
+3.129
7.91%
jan 1, 2005
47.109
+4.41
10.33%
jan 1, 2006
45.876
-1.233
-2.62%
jan 1, 2007
47.688
+1.813
3.95%
jan 1, 2008
48.549
+0.861
1.81%
jan 1, 2009
51.264
+2.715
5.59%
jan 1, 2010
37.759
-13.505
-26.34%
jan 1, 2011
37.953
+0.194
0.51%
jan 1, 2012
38.062
+0.109
0.29%
jan 1, 2013
38.216
+0.154
0.41%
jan 1, 2014
37.786
-0.43
-1.13%
Ranking of countries by current statistics by years


Comments: