29
/
en
AIzaSyAYiBZKx7MnpbEhh9jyipgxe19OcubqV5w
April 1, 2024
175710
Latvia
LVA
true
2
1
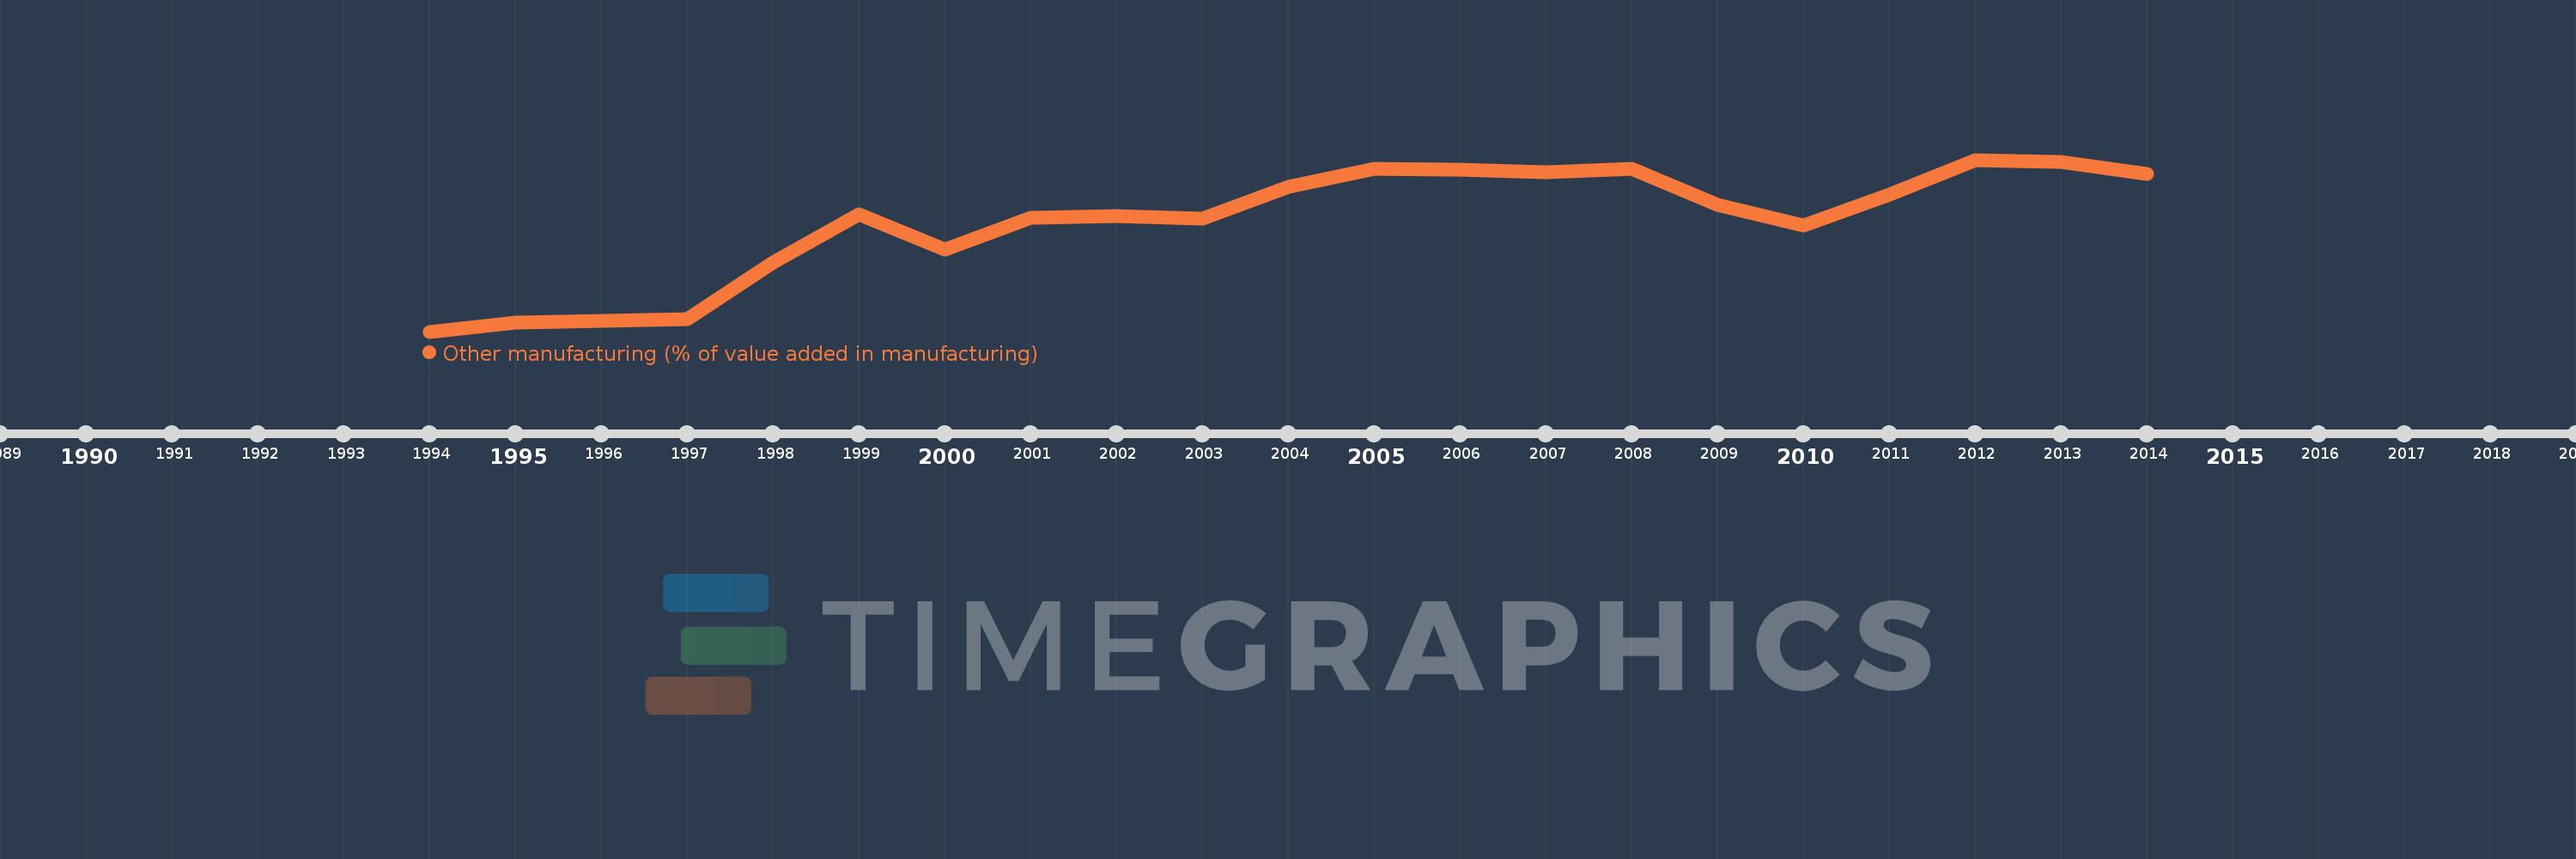
Other manufacturing (% of value added in manufacturing)
2014,2013,2012,2011,2010,2009,2008,2007,2006,2005,2004,2003,2002,2001,2000,1999,1998,1997,1996,1995,1994
This statistics in other country:
AlbaniaAlgeriaArgentinaAustraliaAustriaAzerbaijanBahamas, TheBahrainBangladeshBarbadosBelarusBelgiumBelizeBeninBoliviaBosnia and HerzegovinaBotswanaBrazilBulgariaBurkina FasoBurundiCambodiaCameroonCanadaCentral African RepublicChileChinaColombiaCongo, Rep.Costa RicaCote d'IvoireCroatiaCubaCyprusCzech RepublicDenmarkDominican RepublicEcuadorEgypt, Arab Rep.El SalvadorEritreaEstoniaEthiopiaFijiFinlandFranceGabonGambia, TheGeorgiaGermanyGhanaGreeceGuatemalaHondurasHong Kong SAR, ChinaHungaryIcelandIndiaIndonesiaIran, Islamic Rep.IraqIrelandIsraelItalyJamaicaJapanJordanKazakhstanKenyaKorea, Rep.KuwaitKyrgyz RepublicLao PDRLatviaLebanonLesothoLibyaLithuaniaLuxembourgMacao SAR, ChinaMacedonia, FYRMadagascarMalawiMalaysiaMaltaMauritiusMexicoMoldovaMongoliaMoroccoMozambiqueNamibiaNepalNetherlandsNew ZealandNicaraguaNigerNigeriaNorwayOmanPakistanPanamaPapua New GuineaParaguayPeruPhilippinesPolandPortugalPuerto RicoQatarRomaniaRussian FederationRwandaSaudi ArabiaSenegalSerbiaSierra LeoneSingaporeSlovak RepublicSloveniaSomaliaSouth AfricaSpainSri LankaSt. LuciaSudanSwazilandSwedenSwitzerlandSyrian Arab RepublicTanzaniaThailandTongaTrinidad and TobagoTunisiaTurkeyUgandaUkraineUnited Arab EmiratesUnited KingdomUnited StatesUruguayVenezuela, RBVietnamWest Bank and GazaYemen, Rep.Zambia Timeline:
This timeline shows a graph from 1994 to 2014 of Latvia. No data until 1993. Number of actual observations by date: 21.
Source name:
World Development Indicators
Source organization:
United Nations Industrial Development Organization, International Yearbook of Industrial Statistics.
Categories, topics:
Economy & Growth
Last updated:
apr 23, 2017
Indicators value changes by year
Minimum:
31.275
jan 1, 1994
At the date of observation
Value
Absolute change
Change from previous value
jan 1, 1994
31.275
+31.275
0.0%
jan 1, 1995
32.865
+1.589
5.08%
jan 1, 1996
33.128
+0.263
0.8%
jan 1, 1997
33.394
+0.266
0.8%
jan 1, 1998
43.362
+9.968
29.85%
jan 1, 1999
51.892
+8.53
19.67%
jan 1, 2000
45.622
-6.271
-12.08%
jan 1, 2001
51.285
+5.664
12.41%
jan 1, 2002
51.595
+0.31
0.6%
jan 1, 2003
51.087
-0.509
-0.99%
jan 1, 2004
56.606
+5.519
10.8%
jan 1, 2005
59.77
+3.164
5.59%
jan 1, 2006
59.696
-0.074
-0.12%
jan 1, 2007
59.169
-0.527
-0.88%
jan 1, 2008
59.846
+0.677
1.14%
jan 1, 2009
53.434
-6.413
-10.72%
jan 1, 2010
49.847
-3.586
-6.71%
jan 1, 2011
55.238
+5.39
10.81%
jan 1, 2012
61.4
+6.162
11.16%
jan 1, 2013
61.032
-0.368
-0.6%
jan 1, 2014
58.99
-2.042
-3.35%
Ranking of countries by current statistics by years


Comments: