29
/
en
AIzaSyAYiBZKx7MnpbEhh9jyipgxe19OcubqV5w
April 1, 2024
151901
Hong Kong SAR, China
HKG
true
2
1
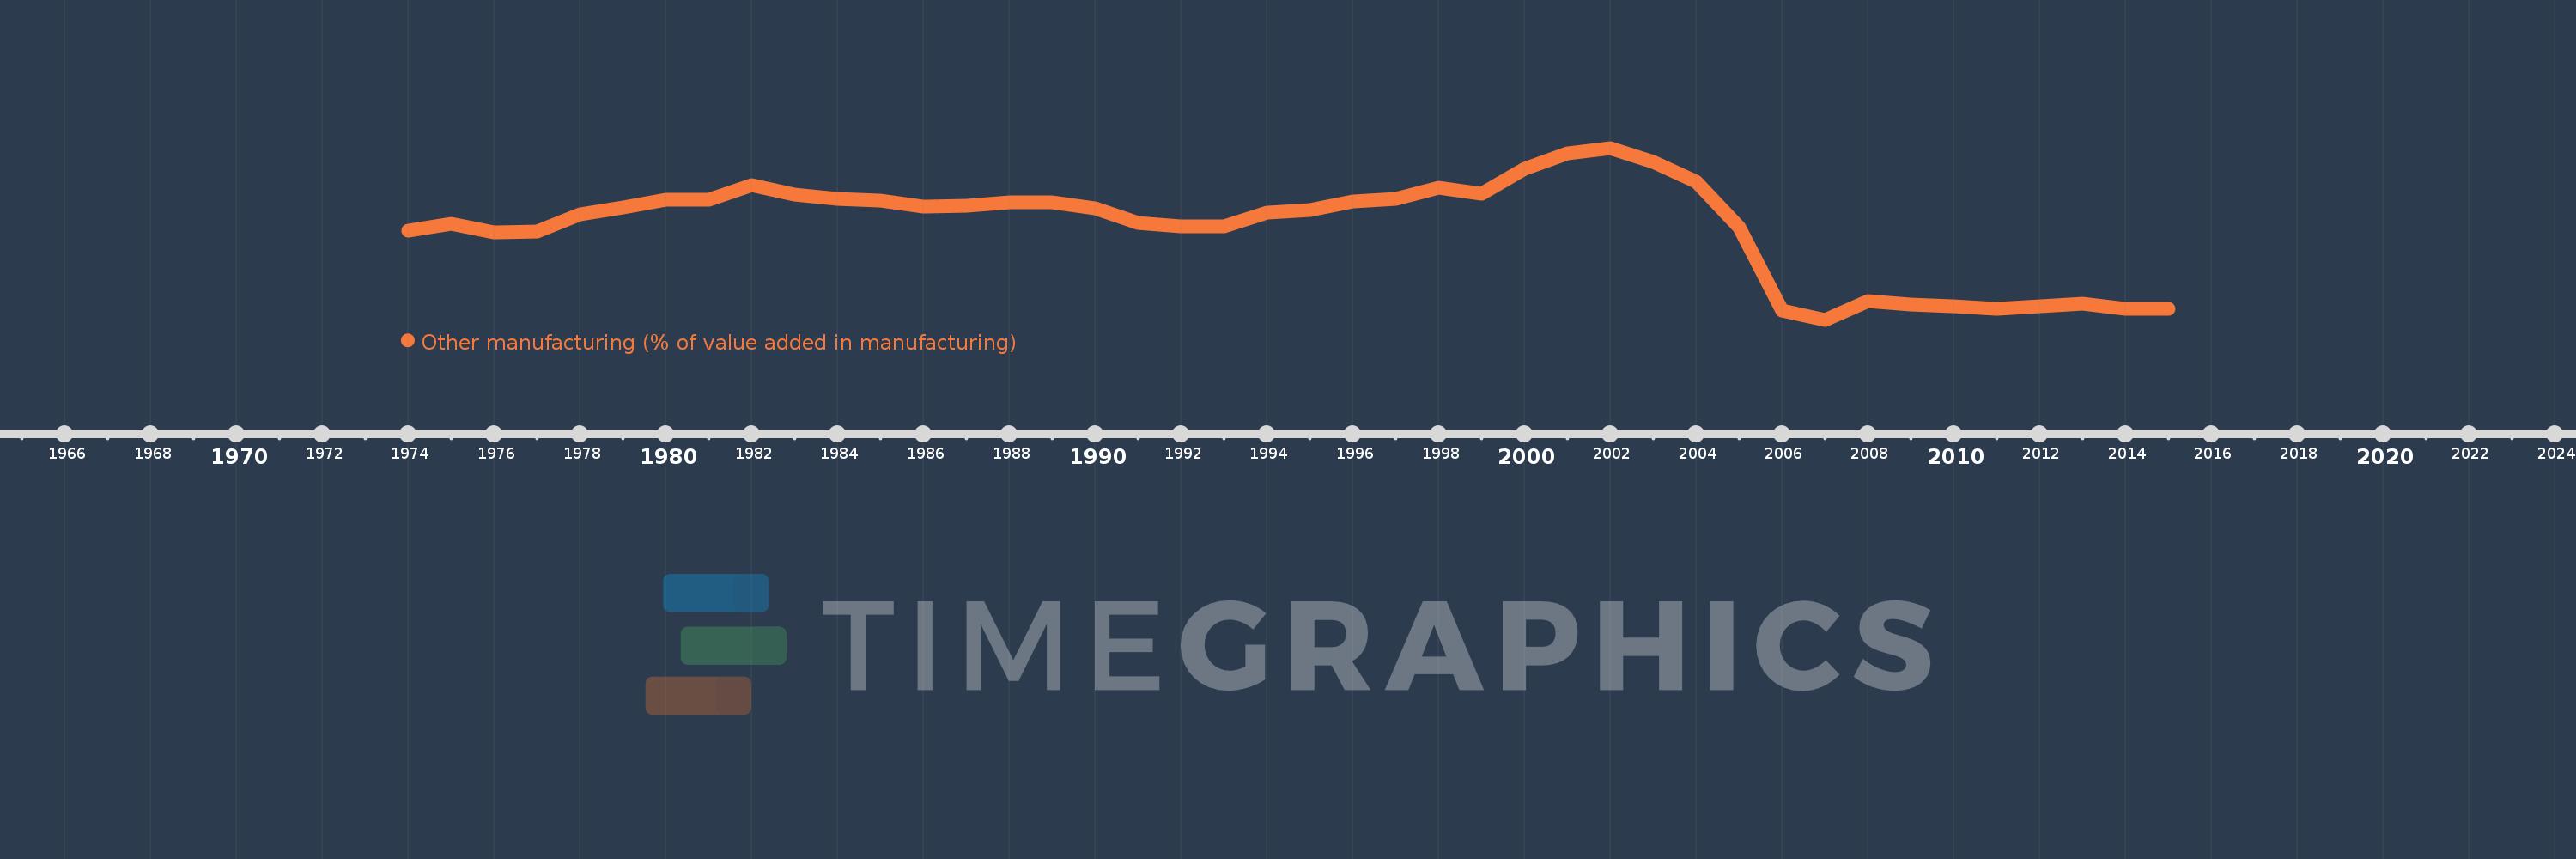
Other manufacturing (% of value added in manufacturing)
2015,2014,2013,2012,2011,2010,2009,2008,2007,2006,2005,2004,2003,2002,2001,2000,1999,1998,1997,1996,1995,1994,1993,1992,1991,1990,1989,1988,1987,1986,1985,1984,1983,1982,1981,1980,1979,1978,1977,1976,1975,1974
This statistics in other country:
AlbaniaAlgeriaArgentinaAustraliaAustriaAzerbaijanBahamas, TheBahrainBangladeshBarbadosBelarusBelgiumBelizeBeninBoliviaBosnia and HerzegovinaBotswanaBrazilBulgariaBurkina FasoBurundiCambodiaCameroonCanadaCentral African RepublicChileChinaColombiaCongo, Rep.Costa RicaCote d'IvoireCroatiaCubaCyprusCzech RepublicDenmarkDominican RepublicEcuadorEgypt, Arab Rep.El SalvadorEritreaEstoniaEthiopiaFijiFinlandFranceGabonGambia, TheGeorgiaGermanyGhanaGreeceGuatemalaHondurasHong Kong SAR, ChinaHungaryIcelandIndiaIndonesiaIran, Islamic Rep.IraqIrelandIsraelItalyJamaicaJapanJordanKazakhstanKenyaKorea, Rep.KuwaitKyrgyz RepublicLao PDRLatviaLebanonLesothoLibyaLithuaniaLuxembourgMacao SAR, ChinaMacedonia, FYRMadagascarMalawiMalaysiaMaltaMauritiusMexicoMoldovaMongoliaMoroccoMozambiqueNamibiaNepalNetherlandsNew ZealandNicaraguaNigerNigeriaNorwayOmanPakistanPanamaPapua New GuineaParaguayPeruPhilippinesPolandPortugalPuerto RicoQatarRomaniaRussian FederationRwandaSaudi ArabiaSenegalSerbiaSierra LeoneSingaporeSlovak RepublicSloveniaSomaliaSouth AfricaSpainSri LankaSt. LuciaSudanSwazilandSwedenSwitzerlandSyrian Arab RepublicTanzaniaThailandTongaTrinidad and TobagoTunisiaTurkeyUgandaUkraineUnited Arab EmiratesUnited KingdomUnited StatesUruguayVenezuela, RBVietnamWest Bank and GazaYemen, Rep.Zambia Timeline:
This timeline shows a graph from 1974 to 2015 of Hong Kong SAR, China. No data until 1973. Number of actual observations by date: 42.
Source name:
World Development Indicators
Source organization:
United Nations Industrial Development Organization, International Yearbook of Industrial Statistics.
Categories, topics:
Economy & Growth
Last updated:
apr 23, 2017
Indicators value changes by year
Maximum:
58.804
jan 1, 2002
At the date of observation
Value
Absolute change
Change from previous value
jan 1, 1974
40.461
+40.461
0.0%
jan 1, 1975
42.04
+1.578
3.9%
jan 1, 1976
40.095
-1.944
-4.63%
jan 1, 1977
40.244
+0.149
0.37%
jan 1, 1978
44.171
+3.926
9.76%
jan 1, 1979
45.574
+1.404
3.18%
jan 1, 1980
47.32
+1.746
3.83%
jan 1, 1981
47.289
-0.031
-0.06%
jan 1, 1982
50.516
+3.226
6.82%
jan 1, 1983
48.406
-2.11
-4.18%
jan 1, 1984
47.589
-0.817
-1.69%
jan 1, 1985
47.178
-0.411
-0.86%
jan 1, 1986
45.79
-1.388
-2.94%
jan 1, 1987
46.015
+0.225
0.49%
jan 1, 1988
46.733
+0.718
1.56%
jan 1, 1989
46.807
+0.074
0.16%
jan 1, 1990
45.511
-1.296
-2.77%
jan 1, 1991
42.27
-3.241
-7.12%
jan 1, 1992
41.465
-0.805
-1.9%
jan 1, 1993
41.387
-0.077
-0.19%
jan 1, 1994
44.464
+3.077
7.44%
jan 1, 1995
45.054
+0.59
1.33%
jan 1, 1996
47.023
+1.968
4.37%
jan 1, 1997
47.53
+0.507
1.08%
jan 1, 1998
50.017
+2.487
5.23%
jan 1, 1999
48.601
-1.416
-2.83%
jan 1, 2000
54.123
+5.522
11.36%
jan 1, 2001
57.536
+3.413
6.31%
jan 1, 2002
58.804
+1.268
2.2%
jan 1, 2003
55.676
-3.128
-5.32%
jan 1, 2004
51.362
-4.315
-7.75%
jan 1, 2005
41.167
-10.195
-19.85%
jan 1, 2006
22.725
-18.442
-44.8%
jan 1, 2007
20.76
-1.966
-8.65%
jan 1, 2008
24.897
+4.137
19.93%
jan 1, 2009
24.204
-0.693
-2.78%
jan 1, 2010
23.748
-0.456
-1.88%
jan 1, 2011
23.186
-0.562
-2.37%
jan 1, 2012
23.823
+0.637
2.75%
jan 1, 2013
24.376
+0.552
2.32%
jan 1, 2014
23.246
-1.13
-4.64%
jan 1, 2015
23.243
-0.002
-0.01%
Ranking of countries by current statistics by years


Comments: