29
/
en
AIzaSyAYiBZKx7MnpbEhh9jyipgxe19OcubqV5w
April 1, 2024
244878
Somalia
SOM
true
2
1
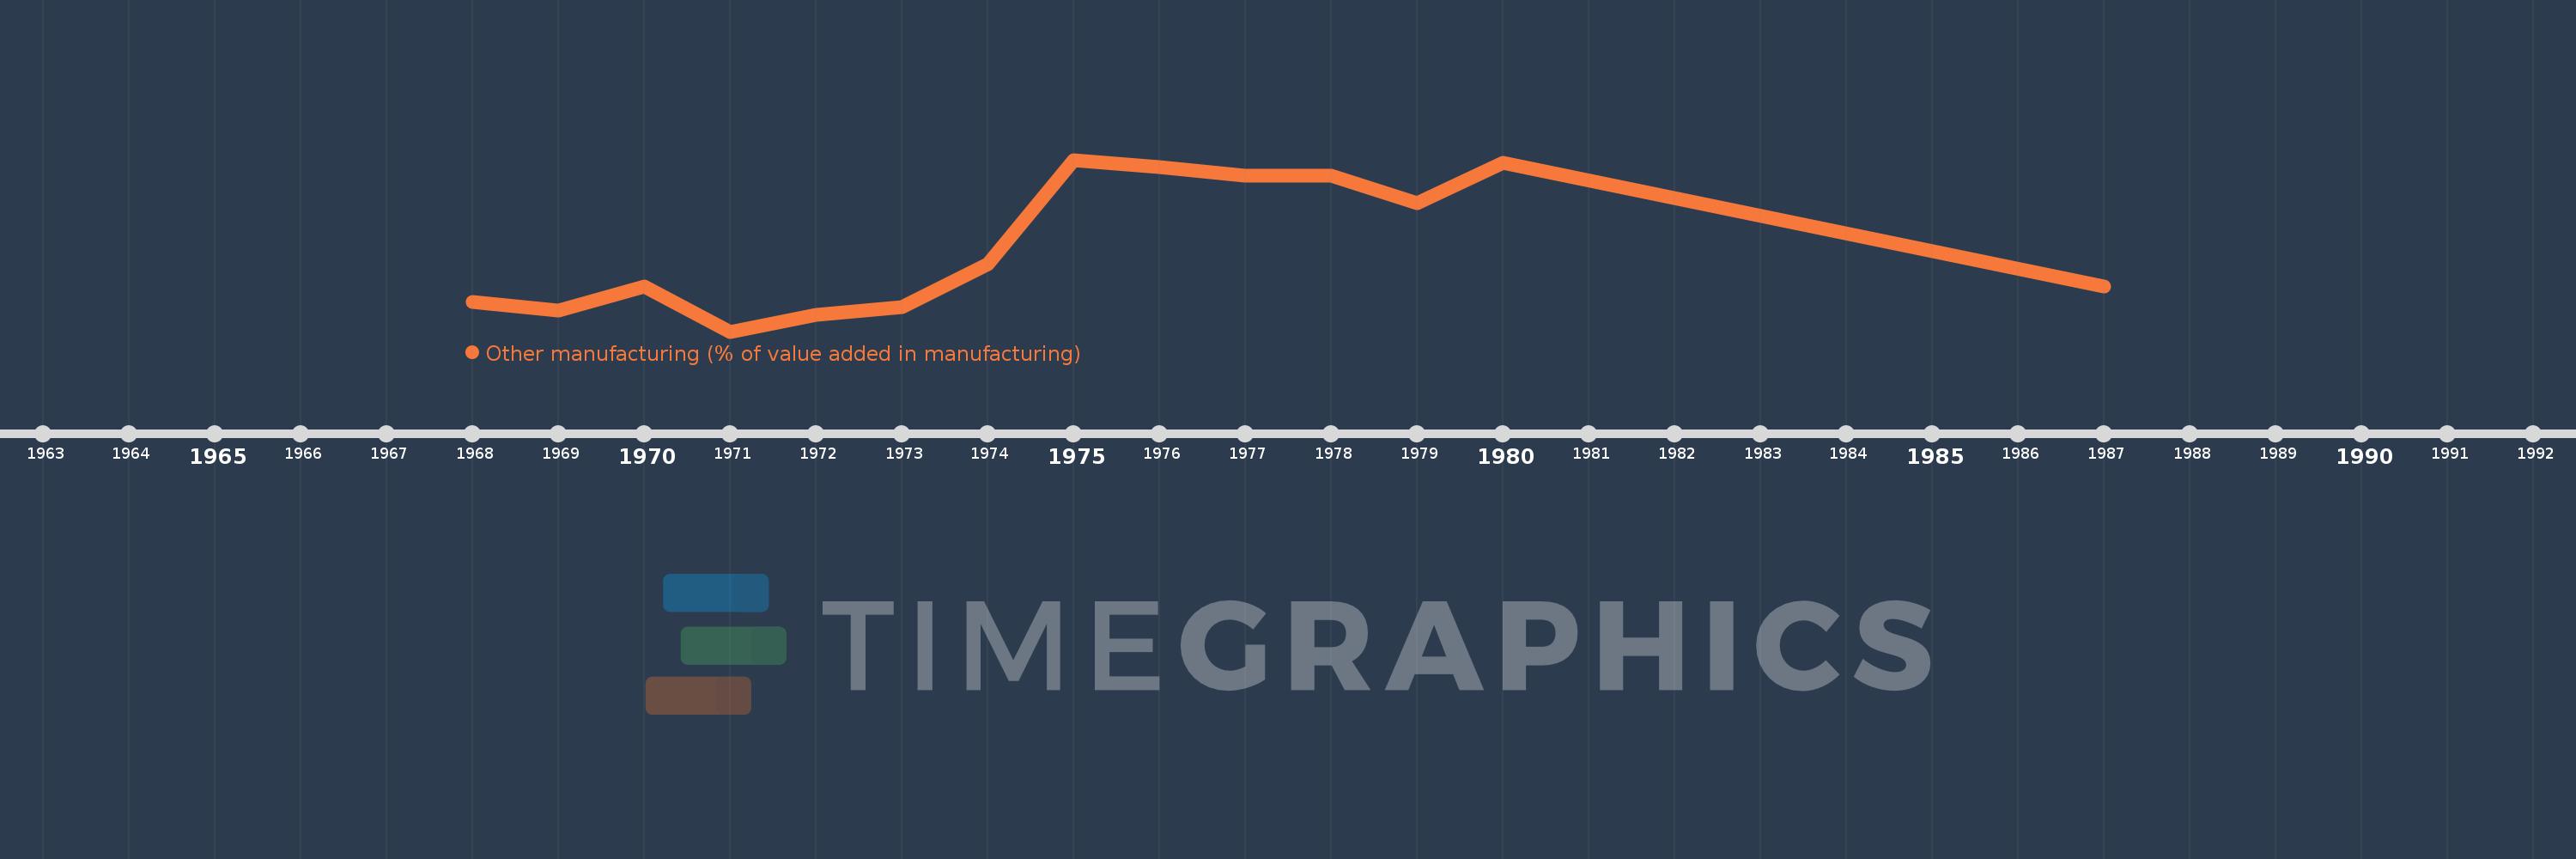
Other manufacturing (% of value added in manufacturing)
1987,1980,1979,1978,1977,1976,1975,1974,1973,1972,1971,1970,1969,1968
This statistics in other country:
AlbaniaAlgeriaArgentinaAustraliaAustriaAzerbaijanBahamas, TheBahrainBangladeshBarbadosBelarusBelgiumBelizeBeninBoliviaBosnia and HerzegovinaBotswanaBrazilBulgariaBurkina FasoBurundiCambodiaCameroonCanadaCentral African RepublicChileChinaColombiaCongo, Rep.Costa RicaCote d'IvoireCroatiaCubaCyprusCzech RepublicDenmarkDominican RepublicEcuadorEgypt, Arab Rep.El SalvadorEritreaEstoniaEthiopiaFijiFinlandFranceGabonGambia, TheGeorgiaGermanyGhanaGreeceGuatemalaHondurasHong Kong SAR, ChinaHungaryIcelandIndiaIndonesiaIran, Islamic Rep.IraqIrelandIsraelItalyJamaicaJapanJordanKazakhstanKenyaKorea, Rep.KuwaitKyrgyz RepublicLao PDRLatviaLebanonLesothoLibyaLithuaniaLuxembourgMacao SAR, ChinaMacedonia, FYRMadagascarMalawiMalaysiaMaltaMauritiusMexicoMoldovaMongoliaMoroccoMozambiqueNamibiaNepalNetherlandsNew ZealandNicaraguaNigerNigeriaNorwayOmanPakistanPanamaPapua New GuineaParaguayPeruPhilippinesPolandPortugalPuerto RicoQatarRomaniaRussian FederationRwandaSaudi ArabiaSenegalSerbiaSierra LeoneSingaporeSlovak RepublicSloveniaSomaliaSouth AfricaSpainSri LankaSt. LuciaSudanSwazilandSwedenSwitzerlandSyrian Arab RepublicTanzaniaThailandTongaTrinidad and TobagoTunisiaTurkeyUgandaUkraineUnited Arab EmiratesUnited KingdomUnited StatesUruguayVenezuela, RBVietnamWest Bank and GazaYemen, Rep.Zambia Timeline:
This timeline shows a graph from 1968 to 1987 of Somalia. No data until 1967. Number of actual observations by date: 14.
Source name:
World Development Indicators
Source organization:
United Nations Industrial Development Organization, International Yearbook of Industrial Statistics.
Categories, topics:
Economy & Growth
Last updated:
apr 23, 2017
Indicators value changes by year
Maximum:
34.718
jan 1, 1975
At the date of observation
Value
Absolute change
Change from previous value
jan 1, 1968
10.764
+10.764
0.0%
jan 1, 1969
9.246
-1.518
-14.1%
jan 1, 1970
13.304
+4.058
43.89%
jan 1, 1971
5.736
-7.568
-56.88%
jan 1, 1972
8.494
+2.758
48.08%
jan 1, 1973
9.877
+1.383
16.28%
jan 1, 1974
17.098
+7.221
73.11%
jan 1, 1975
34.718
+17.619
103.05%
jan 1, 1976
33.45
-1.268
-3.65%
jan 1, 1977
31.97
-1.48
-4.42%
jan 1, 1978
32.079
+0.109
0.34%
jan 1, 1979
27.446
-4.633
-14.44%
jan 1, 1980
34.164
+6.719
24.48%
jan 1, 1987
13.314
-20.85
-61.03%
Ranking of countries by current statistics by years


Comments: