29
/
en
AIzaSyAYiBZKx7MnpbEhh9jyipgxe19OcubqV5w
April 1, 2024
140840
Ghana
GHA
true
2
1
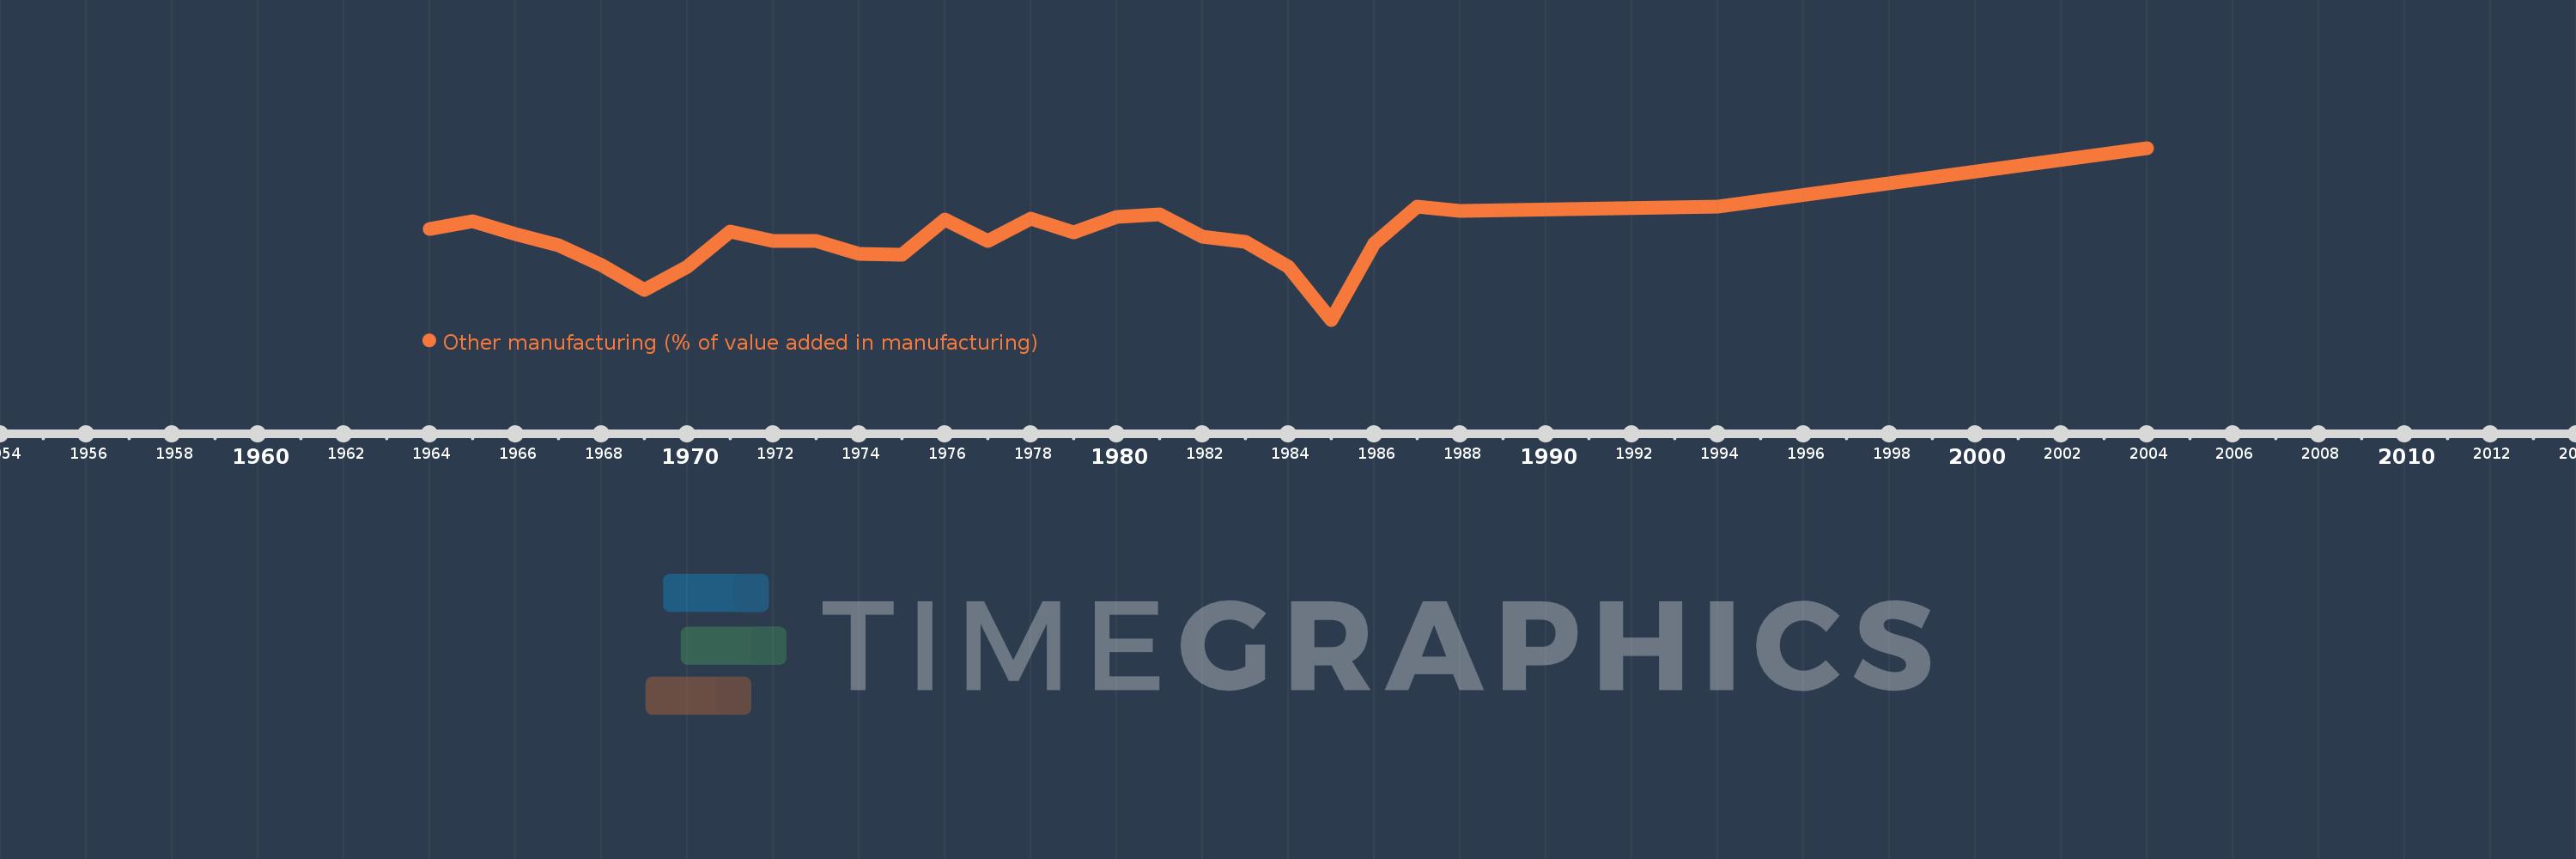
Other manufacturing (% of value added in manufacturing)
2004,1994,1988,1987,1986,1985,1984,1983,1982,1981,1980,1979,1978,1977,1976,1975,1974,1973,1972,1971,1970,1969,1968,1967,1966,1965,1964
This statistics in other country:
AlbaniaAlgeriaArgentinaAustraliaAustriaAzerbaijanBahamas, TheBahrainBangladeshBarbadosBelarusBelgiumBelizeBeninBoliviaBosnia and HerzegovinaBotswanaBrazilBulgariaBurkina FasoBurundiCambodiaCameroonCanadaCentral African RepublicChileChinaColombiaCongo, Rep.Costa RicaCote d'IvoireCroatiaCubaCyprusCzech RepublicDenmarkDominican RepublicEcuadorEgypt, Arab Rep.El SalvadorEritreaEstoniaEthiopiaFijiFinlandFranceGabonGambia, TheGeorgiaGermanyGhanaGreeceGuatemalaHondurasHong Kong SAR, ChinaHungaryIcelandIndiaIndonesiaIran, Islamic Rep.IraqIrelandIsraelItalyJamaicaJapanJordanKazakhstanKenyaKorea, Rep.KuwaitKyrgyz RepublicLao PDRLatviaLebanonLesothoLibyaLithuaniaLuxembourgMacao SAR, ChinaMacedonia, FYRMadagascarMalawiMalaysiaMaltaMauritiusMexicoMoldovaMongoliaMoroccoMozambiqueNamibiaNepalNetherlandsNew ZealandNicaraguaNigerNigeriaNorwayOmanPakistanPanamaPapua New GuineaParaguayPeruPhilippinesPolandPortugalPuerto RicoQatarRomaniaRussian FederationRwandaSaudi ArabiaSenegalSerbiaSierra LeoneSingaporeSlovak RepublicSloveniaSomaliaSouth AfricaSpainSri LankaSt. LuciaSudanSwazilandSwedenSwitzerlandSyrian Arab RepublicTanzaniaThailandTongaTrinidad and TobagoTunisiaTurkeyUgandaUkraineUnited Arab EmiratesUnited KingdomUnited StatesUruguayVenezuela, RBVietnamWest Bank and GazaYemen, Rep.Zambia Timeline:
This timeline shows a graph from 1964 to 2004 of Ghana. No data until 1963. Number of actual observations by date: 27.
Source name:
World Development Indicators
Source organization:
United Nations Industrial Development Organization, International Yearbook of Industrial Statistics.
Categories, topics:
Economy & Growth
Last updated:
apr 23, 2017
Indicators value changes by year
Minimum:
23.849
jan 1, 1985
Maximum:
60.481
jan 1, 2004
At the date of observation
Value
Absolute change
Change from previous value
jan 1, 1964
43.223
+43.223
0.0%
jan 1, 1965
44.857
+1.634
3.78%
jan 1, 1966
42.135
-2.722
-6.07%
jan 1, 1967
39.715
-2.42
-5.74%
jan 1, 1968
35.437
-4.278
-10.77%
jan 1, 1969
30.149
-5.287
-14.92%
jan 1, 1970
35.233
+5.084
16.86%
jan 1, 1971
42.581
+7.348
20.86%
jan 1, 1972
40.672
-1.909
-4.48%
jan 1, 1973
40.623
-0.049
-0.12%
jan 1, 1974
37.926
-2.696
-6.64%
jan 1, 1975
37.705
-0.221
-0.58%
jan 1, 1976
45.209
+7.504
19.9%
jan 1, 1977
40.593
-4.616
-10.21%
jan 1, 1978
45.449
+4.856
11.96%
jan 1, 1979
42.472
-2.978
-6.55%
jan 1, 1980
45.758
+3.287
7.74%
jan 1, 1981
46.266
+0.508
1.11%
jan 1, 1982
41.636
-4.63
-10.01%
jan 1, 1983
40.391
-1.245
-2.99%
jan 1, 1984
35.192
-5.199
-12.87%
jan 1, 1985
23.849
-11.344
-32.23%
jan 1, 1986
40.116
+16.268
68.21%
jan 1, 1987
48.053
+7.937
19.78%
jan 1, 1988
47.139
-0.914
-1.9%
jan 1, 1994
47.9
+0.761
1.61%
jan 1, 2004
60.481
+12.582
26.27%
Ranking of countries by current statistics by years


Comments: