29
/
en
AIzaSyAYiBZKx7MnpbEhh9jyipgxe19OcubqV5w
April 1, 2024
135934
Gabon
GAB
true
2
1
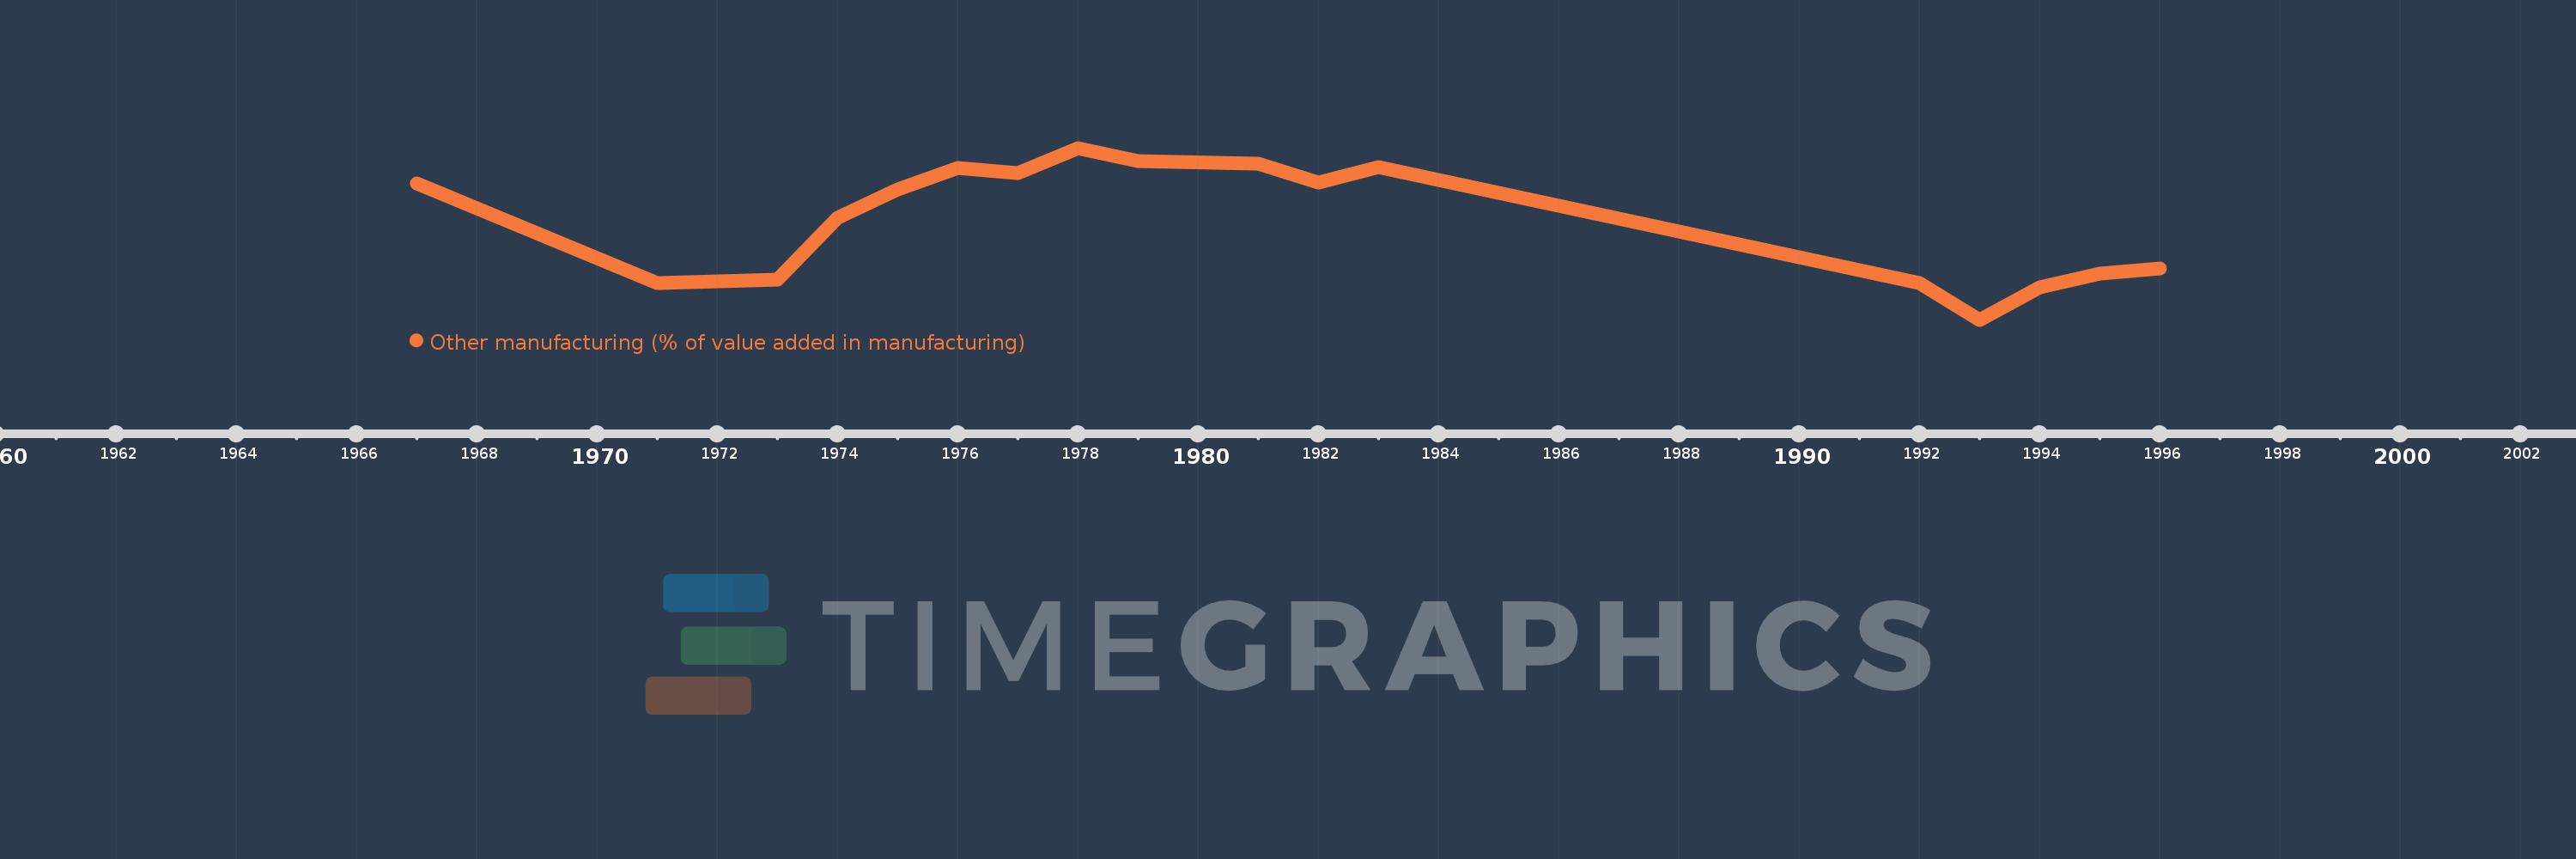
Other manufacturing (% of value added in manufacturing)
1996,1995,1994,1993,1992,1983,1982,1981,1979,1978,1977,1976,1975,1974,1973,1971,1967
This statistics in other country:
AlbaniaAlgeriaArgentinaAustraliaAustriaAzerbaijanBahamas, TheBahrainBangladeshBarbadosBelarusBelgiumBelizeBeninBoliviaBosnia and HerzegovinaBotswanaBrazilBulgariaBurkina FasoBurundiCambodiaCameroonCanadaCentral African RepublicChileChinaColombiaCongo, Rep.Costa RicaCote d'IvoireCroatiaCubaCyprusCzech RepublicDenmarkDominican RepublicEcuadorEgypt, Arab Rep.El SalvadorEritreaEstoniaEthiopiaFijiFinlandFranceGabonGambia, TheGeorgiaGermanyGhanaGreeceGuatemalaHondurasHong Kong SAR, ChinaHungaryIcelandIndiaIndonesiaIran, Islamic Rep.IraqIrelandIsraelItalyJamaicaJapanJordanKazakhstanKenyaKorea, Rep.KuwaitKyrgyz RepublicLao PDRLatviaLebanonLesothoLibyaLithuaniaLuxembourgMacao SAR, ChinaMacedonia, FYRMadagascarMalawiMalaysiaMaltaMauritiusMexicoMoldovaMongoliaMoroccoMozambiqueNamibiaNepalNetherlandsNew ZealandNicaraguaNigerNigeriaNorwayOmanPakistanPanamaPapua New GuineaParaguayPeruPhilippinesPolandPortugalPuerto RicoQatarRomaniaRussian FederationRwandaSaudi ArabiaSenegalSerbiaSierra LeoneSingaporeSlovak RepublicSloveniaSomaliaSouth AfricaSpainSri LankaSt. LuciaSudanSwazilandSwedenSwitzerlandSyrian Arab RepublicTanzaniaThailandTongaTrinidad and TobagoTunisiaTurkeyUgandaUkraineUnited Arab EmiratesUnited KingdomUnited StatesUruguayVenezuela, RBVietnamWest Bank and GazaYemen, Rep.Zambia Timeline:
This timeline shows a graph from 1967 to 1996 of Gabon. No data until 1966. Number of actual observations by date: 17.
Source name:
World Development Indicators
Source organization:
United Nations Industrial Development Organization, International Yearbook of Industrial Statistics.
Categories, topics:
Economy & Growth
Last updated:
apr 23, 2017
Indicators value changes by year
Minimum:
41.769
jan 1, 1993
At the date of observation
Value
Absolute change
Change from previous value
jan 1, 1967
59.054
+59.054
0.0%
jan 1, 1971
46.387
-12.667
-21.45%
jan 1, 1973
46.882
+0.495
1.07%
jan 1, 1974
54.709
+7.827
16.69%
jan 1, 1975
58.287
+3.578
6.54%
jan 1, 1976
61.033
+2.747
4.71%
jan 1, 1977
60.434
-0.6
-0.98%
jan 1, 1978
63.58
+3.146
5.21%
jan 1, 1979
61.928
-1.652
-2.6%
jan 1, 1981
61.627
-0.301
-0.49%
jan 1, 1982
59.216
-2.411
-3.91%
jan 1, 1983
61.169
+1.953
3.3%
jan 1, 1992
46.425
-14.744
-24.1%
jan 1, 1993
41.769
-4.656
-10.03%
jan 1, 1994
45.931
+4.161
9.96%
jan 1, 1995
47.587
+1.656
3.61%
jan 1, 1996
48.291
+0.704
1.48%
Ranking of countries by current statistics by years


Comments: