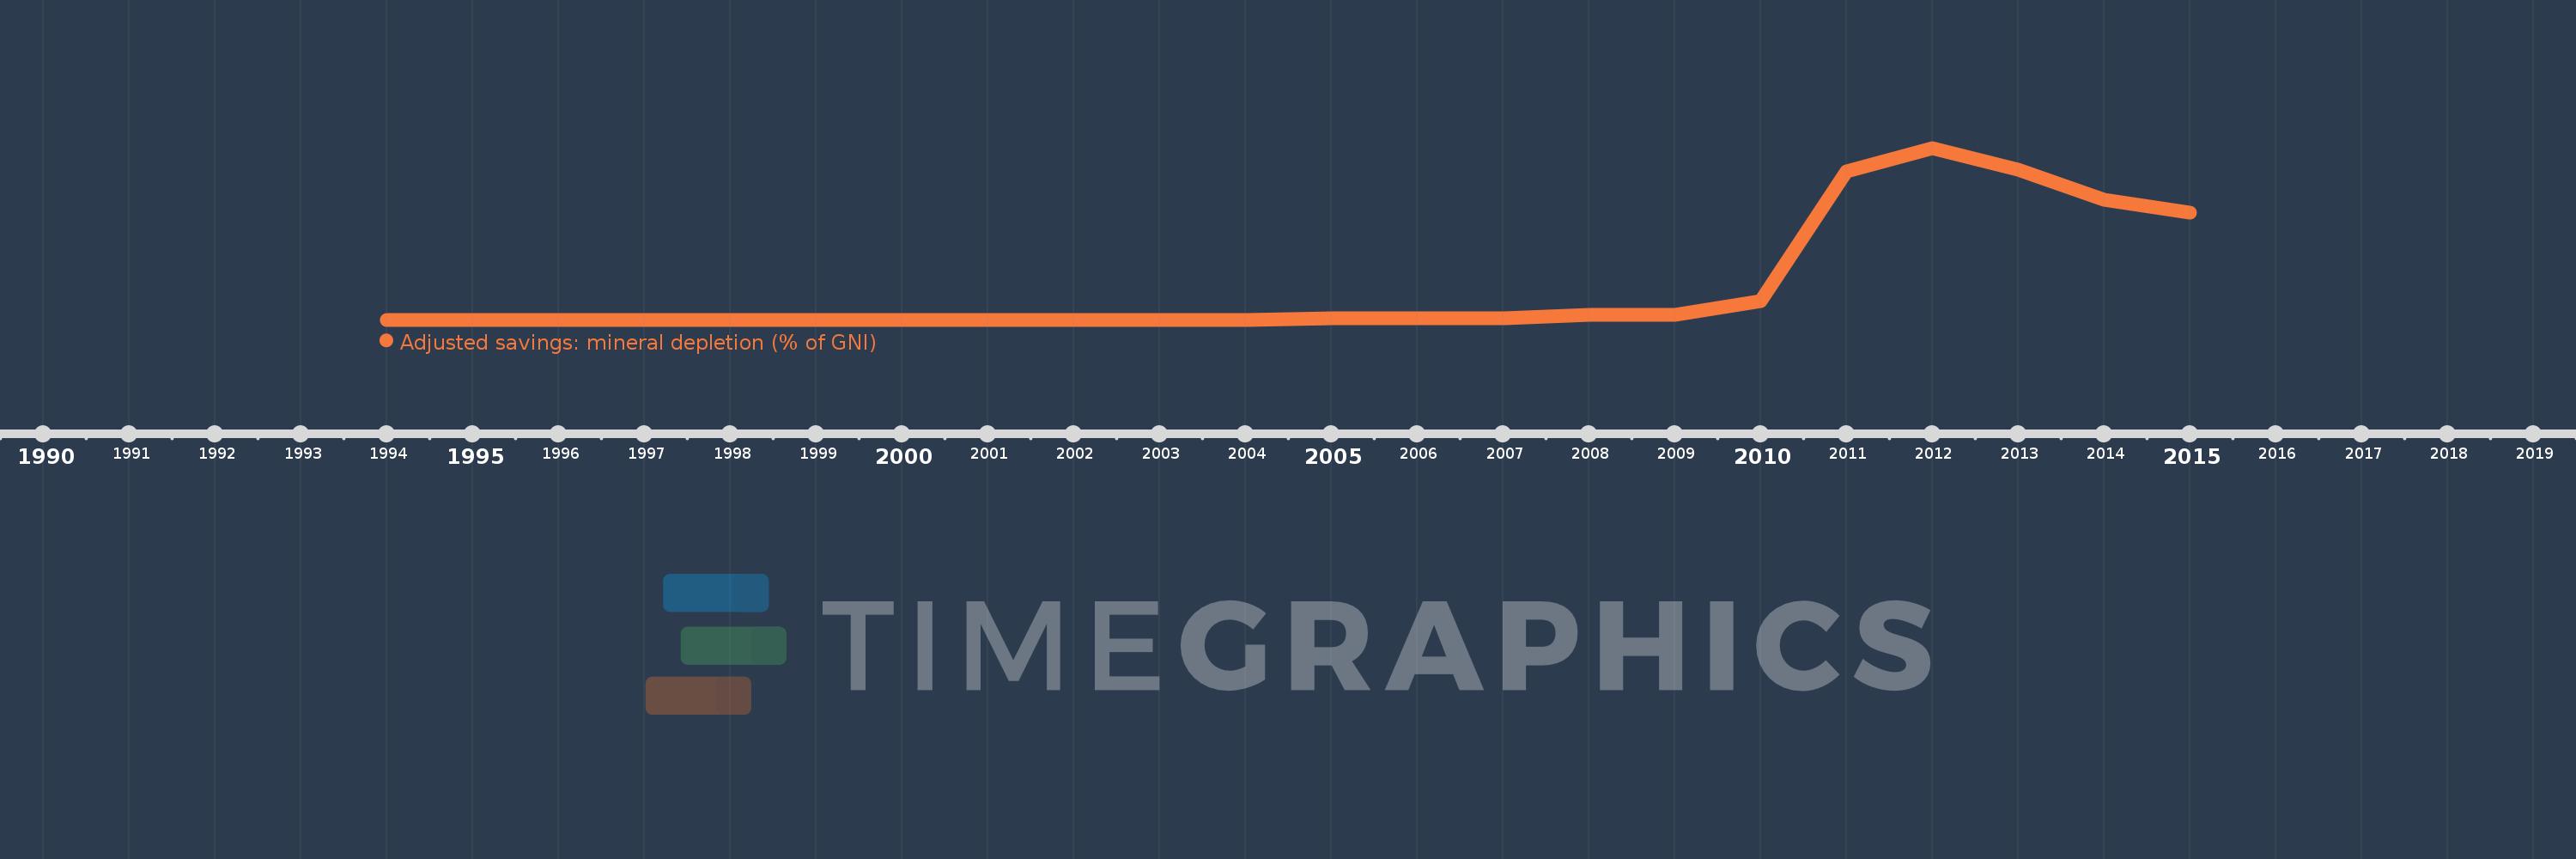
This timeline shows a graph from 1994 to 2015 of Azerbaijan. No data until 1993. Number of actual observations by date: 22.
Source name:
World Development Indicators
Source organization:
World Bank staff estimates based on sources and methods in World Bank's "The Changing Wealth of Nations: Measuring Sustainable Development in the New Millennium" (2011).
Categories, topics:
Economy & Growth, Energy & Mining, Environment
Last updated:
apr 23, 2017
Indicators value changes by year
Meaning:
0.021
Minimum:
0.0
jan 1, 1994
Maximum:
0.109
jan 1, 2012
At the date of observation
Value
Absolute change
Change from the previous value
jan 1, 1994
0.0
0.0
0.0%
jan 1, 1995
0.0
0.0
%
jan 1, 1996
0.0
0.0
%
jan 1, 1997
0.0
0.0
%
jan 1, 1998
0.0
0.0
%
jan 1, 1999
0.0
+0.0
%
jan 1, 2000
0.0
0.0
-100.0%
jan 1, 2001
0.0
0.0
%
jan 1, 2002
0.0
0.0
%
jan 1, 2003
0.0
0.0
%
jan 1, 2004
0.0
0.0
%
jan 1, 2005
0.001
+0.001
%
jan 1, 2006
0.001
+0.0
6.61%
jan 1, 2007
0.001
+0.0
8.14%
jan 1, 2008
0.003
+0.001
139.39%
jan 1, 2009
0.003
+0.001
37.07%
jan 1, 2010
0.012
+0.009
255.66%
jan 1, 2011
0.094
+0.082
663.3%
jan 1, 2012
0.109
+0.015
15.41%
jan 1, 2013
0.095
-0.014
-13.12%
jan 1, 2014
0.076
-0.019
-20.06%
jan 1, 2015
0.068
-0.008
-10.31%
Ranking of countries by current statistics by years
