29
/
en
AIzaSyAYiBZKx7MnpbEhh9jyipgxe19OcubqV5w
April 1, 2024
267596
Tunisia
TUN
true
2
1
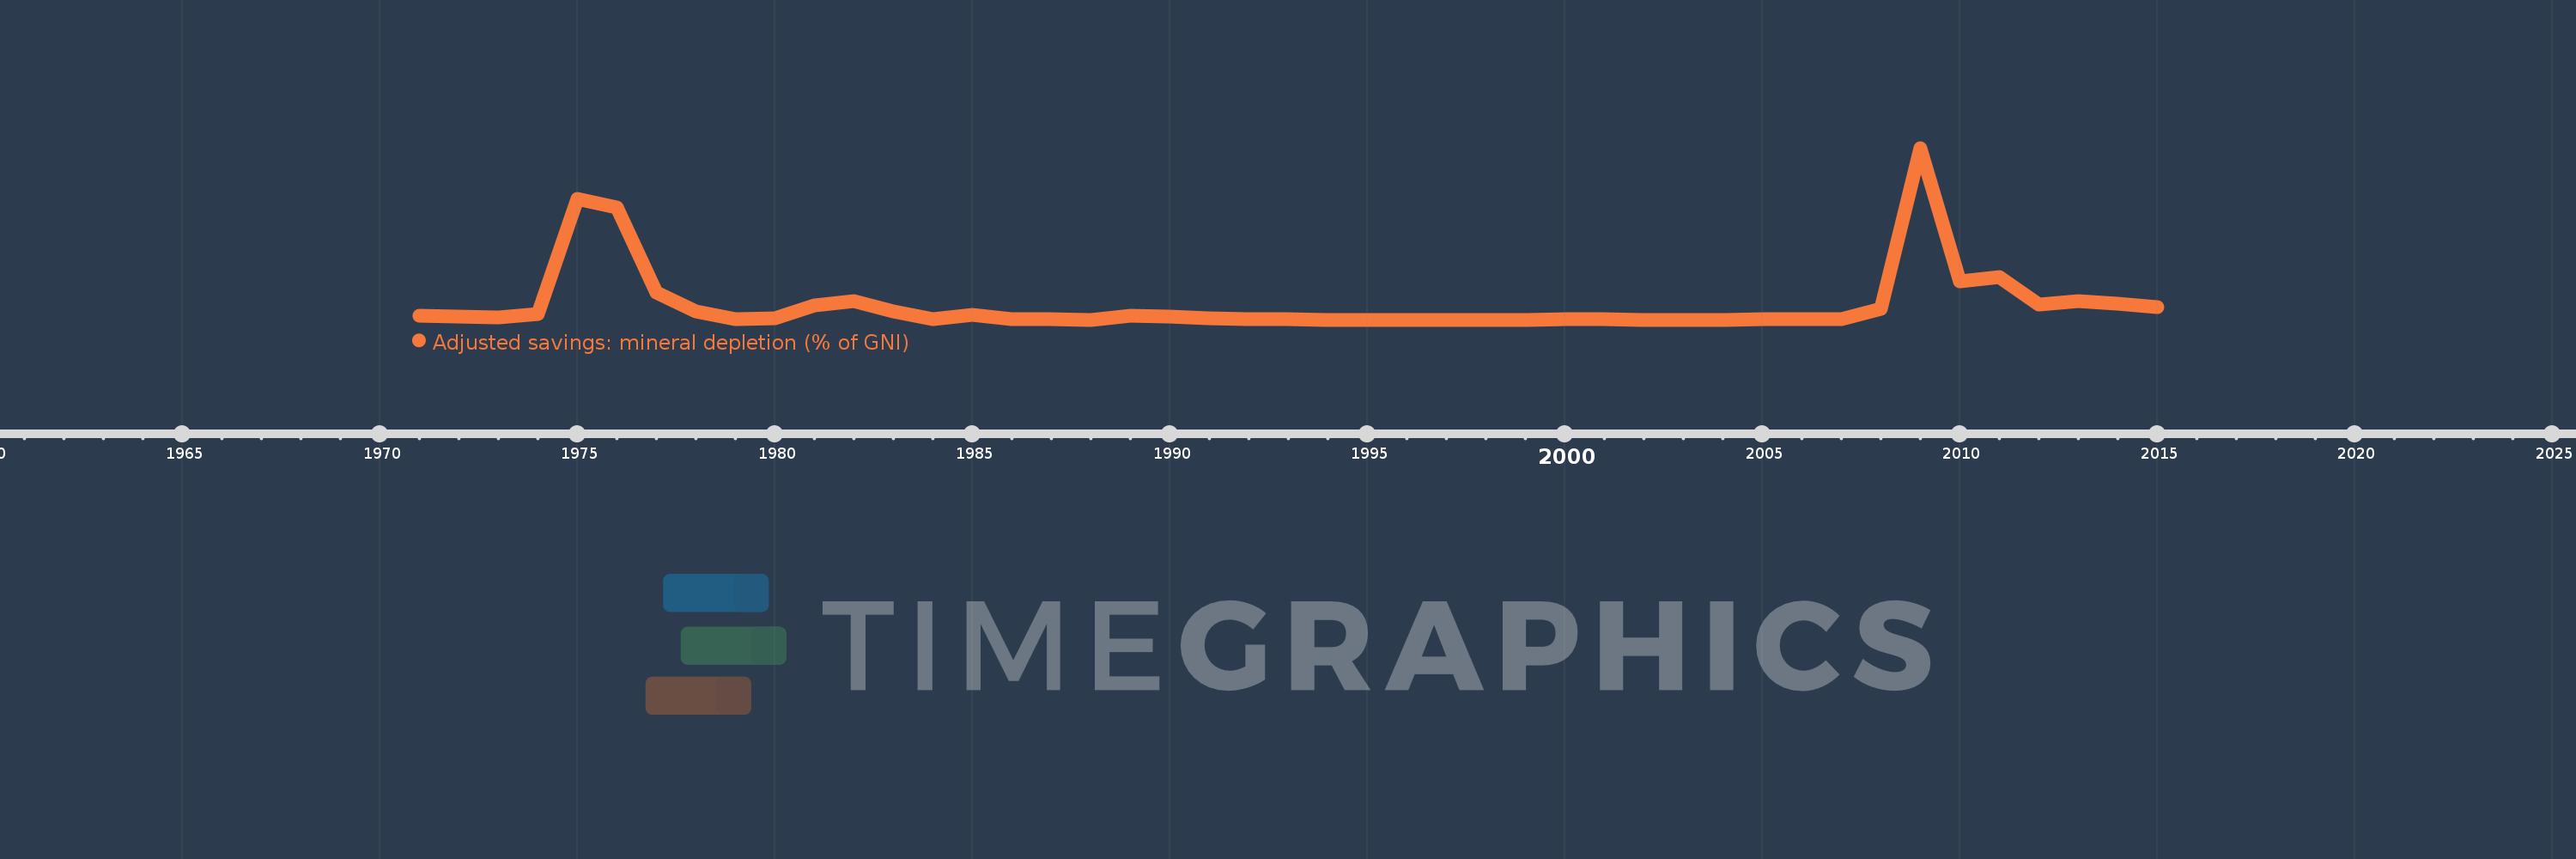
Adjusted savings: mineral depletion (% of GNI)
2015,2014,2013,2012,2011,2010,2009,2008,2007,2006,2005,2004,2003,2002,2001,2000,1999,1998,1997,1996,1995,1994,1993,1992,1991,1990,1989,1988,1987,1986,1985,1984,1983,1982,1981,1980,1979,1978,1977,1976,1975,1974,1973,1972,1971
This statistics in other country:
AfghanistanAlbaniaAlgeriaAmerican SamoaAndorraAngolaAntigua and BarbudaArab WorldArgentinaArmeniaAustraliaAustriaAzerbaijanBahamas, TheBahrainBangladeshBarbadosBelarusBelgiumBelizeBeninBermudaBhutanBoliviaBosnia and HerzegovinaBotswanaBrazilBrunei DarussalamBulgariaBurkina FasoBurundiCabo VerdeCambodiaCameroonCanadaCaribbean small statesCentral African RepublicCentral Europe and the BalticsChadChannel IslandsChileChinaColombiaComorosCongo, Dem. Rep.Congo, Rep.Costa RicaCote d'IvoireCroatiaCubaCyprusCzech RepublicDenmarkDjiboutiDominicaDominican RepublicEarly-demographic dividendEast Asia & PacificEast Asia & Pacific (excluding high income)East Asia & Pacific (IDA & IBRD countries)EcuadorEgypt, Arab Rep.El SalvadorEquatorial GuineaEritreaEstoniaEthiopiaEuro areaEurope & Central AsiaEurope & Central Asia (excluding high income)Europe & Central Asia (IDA & IBRD countries)European UnionFaroe IslandsFijiFinlandFragile and conflict affected situationsFranceFrench PolynesiaGabonGambia, TheGeorgiaGermanyGhanaGreeceGreenlandGrenadaGuatemalaGuineaGuinea-BissauGuyanaHaitiHeavily indebted poor countries (HIPC)High incomeHondurasHong Kong SAR, ChinaHungaryIBRD onlyIcelandIDA & IBRD totalIDA blendIDA onlyIDA totalIndiaIndonesiaIran, Islamic Rep.IraqIrelandIsle of ManIsraelItalyJamaicaJapanJordanKazakhstanKenyaKiribatiKorea, Rep.KosovoKuwaitKyrgyz RepublicLao PDRLate-demographic dividendLatin America & Caribbean Latin America & Caribbean (excluding high income)Latin America & the Caribbean (IDA & IBRD countries)LatviaLeast developed countries: UN classificationLebanonLesothoLiberiaLibyaLiechtensteinLithuaniaLow & middle incomeLow incomeLower middle incomeLuxembourgMacao SAR, ChinaMacedonia, FYRMadagascarMalawiMalaysiaMaldivesMaliMaltaMarshall IslandsMauritaniaMauritiusMexicoMicronesia, Fed. Sts.Middle East & North AfricaMiddle East & North Africa (excluding high income)Middle East & North Africa (IDA & IBRD countries)Middle incomeMoldovaMonacoMongoliaMontenegroMoroccoMozambiqueMyanmarNamibiaNepalNetherlandsNew CaledoniaNew ZealandNicaraguaNigerNigeriaNorth AmericaNorwayOECD membersOmanOther small statesPacific island small statesPakistanPalauPanamaPapua New GuineaParaguayPeruPhilippinesPolandPortugalPost-demographic dividendPre-demographic dividendPuerto RicoQatarRomaniaRussian FederationRwandaSamoaSan MarinoSao Tome and PrincipeSaudi ArabiaSenegalSerbiaSeychellesSierra LeoneSingaporeSlovak RepublicSloveniaSmall statesSolomon IslandsSomaliaSouth AfricaSouth AsiaSouth Asia (IDA & IBRD)South SudanSpainSri LankaSt. Kitts and NevisSt. LuciaSt. Vincent and the GrenadinesSub-Saharan Africa Sub-Saharan Africa (excluding high income)Sub-Saharan Africa (IDA & IBRD countries)SudanSurinameSwazilandSwedenSwitzerlandSyrian Arab RepublicTajikistanTanzaniaThailandTimor-LesteTogoTongaTrinidad and TobagoTunisiaTurkeyTurkmenistanTuvaluUgandaUkraineUnited Arab EmiratesUnited KingdomUnited StatesUpper middle incomeUruguayUzbekistanVanuatuVenezuela, RBVietnamVirgin Islands (U.S.)West Bank and GazaWorldYemen, Rep.ZambiaZimbabwe Timeline:
This timeline shows a graph from 1971 to 2015 of Tunisia. No data until 1970. Number of actual observations by date: 45.
Source name:
World Development Indicators
Source organization:
World Bank staff estimates based on sources and methods in World Bank's "The Changing Wealth of Nations: Measuring Sustainable Development in the New Millennium" (2011).
Categories, topics:
Economy & Growth, Energy & Mining, Environment
Last updated:
apr 23, 2017
Indicators value changes by year
At the date of observation
Value
Absolute change
Change from previous value
jan 1, 1971
0.096
+0.096
0.0%
jan 1, 1972
0.074
-0.022
-22.65%
jan 1, 1973
0.058
-0.016
-21.95%
jan 1, 1974
0.141
+0.083
143.22%
jan 1, 1975
2.845
+2.704
1.91K%
jan 1, 1976
2.641
-0.204
-7.17%
jan 1, 1977
0.643
-1.999
-75.68%
jan 1, 1978
0.205
-0.438
-68.15%
jan 1, 1979
0.018
-0.187
-91.24%
jan 1, 1980
0.045
+0.027
149.06%
jan 1, 1981
0.333
+0.289
646.18%
jan 1, 1982
0.448
+0.114
34.26%
jan 1, 1983
0.192
-0.255
-57.05%
jan 1, 1984
0.019
-0.173
-90.2%
jan 1, 1985
0.126
+0.107
567.69%
jan 1, 1986
0.019
-0.106
-84.61%
jan 1, 1987
0.01
-0.009
-49.01%
jan 1, 1988
0.006
-0.004
-37.59%
jan 1, 1989
0.09
+0.084
1.36K%
jan 1, 1990
0.078
-0.012
-12.96%
jan 1, 1991
0.039
-0.04
-50.79%
jan 1, 1992
0.011
-0.027
-70.18%
jan 1, 1993
0.01
-0.001
-11.75%
jan 1, 1994
0.006
-0.004
-42.74%
jan 1, 1995
0.004
-0.001
-24.47%
jan 1, 1996
0.003
-0.001
-32.6%
jan 1, 1997
0.004
+0.001
19.3%
jan 1, 1998
0.006
+0.002
60.32%
jan 1, 1999
0.007
+0.001
15.7%
jan 1, 2000
0.008
+0.002
28.01%
jan 1, 2001
0.018
+0.009
111.5%
jan 1, 2002
0.006
-0.012
-65.58%
jan 1, 2003
0.005
-0.001
-11.19%
jan 1, 2004
0.004
-0.001
-20.88%
jan 1, 2005
0.008
+0.003
80.79%
jan 1, 2006
0.023
+0.015
192.78%
jan 1, 2007
0.015
-0.008
-34.82%
jan 1, 2008
0.258
+0.243
1.64K%
jan 1, 2009
4.048
+3.79
1.47K%
jan 1, 2010
0.904
-3.144
-77.66%
jan 1, 2011
1.003
+0.099
10.98%
jan 1, 2012
0.37
-0.633
-63.13%
jan 1, 2013
0.437
+0.067
18.23%
jan 1, 2014
0.384
-0.053
-12.12%
jan 1, 2015
0.305
-0.079
-20.54%
Ranking of countries by current statistics by years


Comments: