29
/
en
AIzaSyAYiBZKx7MnpbEhh9jyipgxe19OcubqV5w
April 1, 2024
45822
Low income
LIC
false
2
1
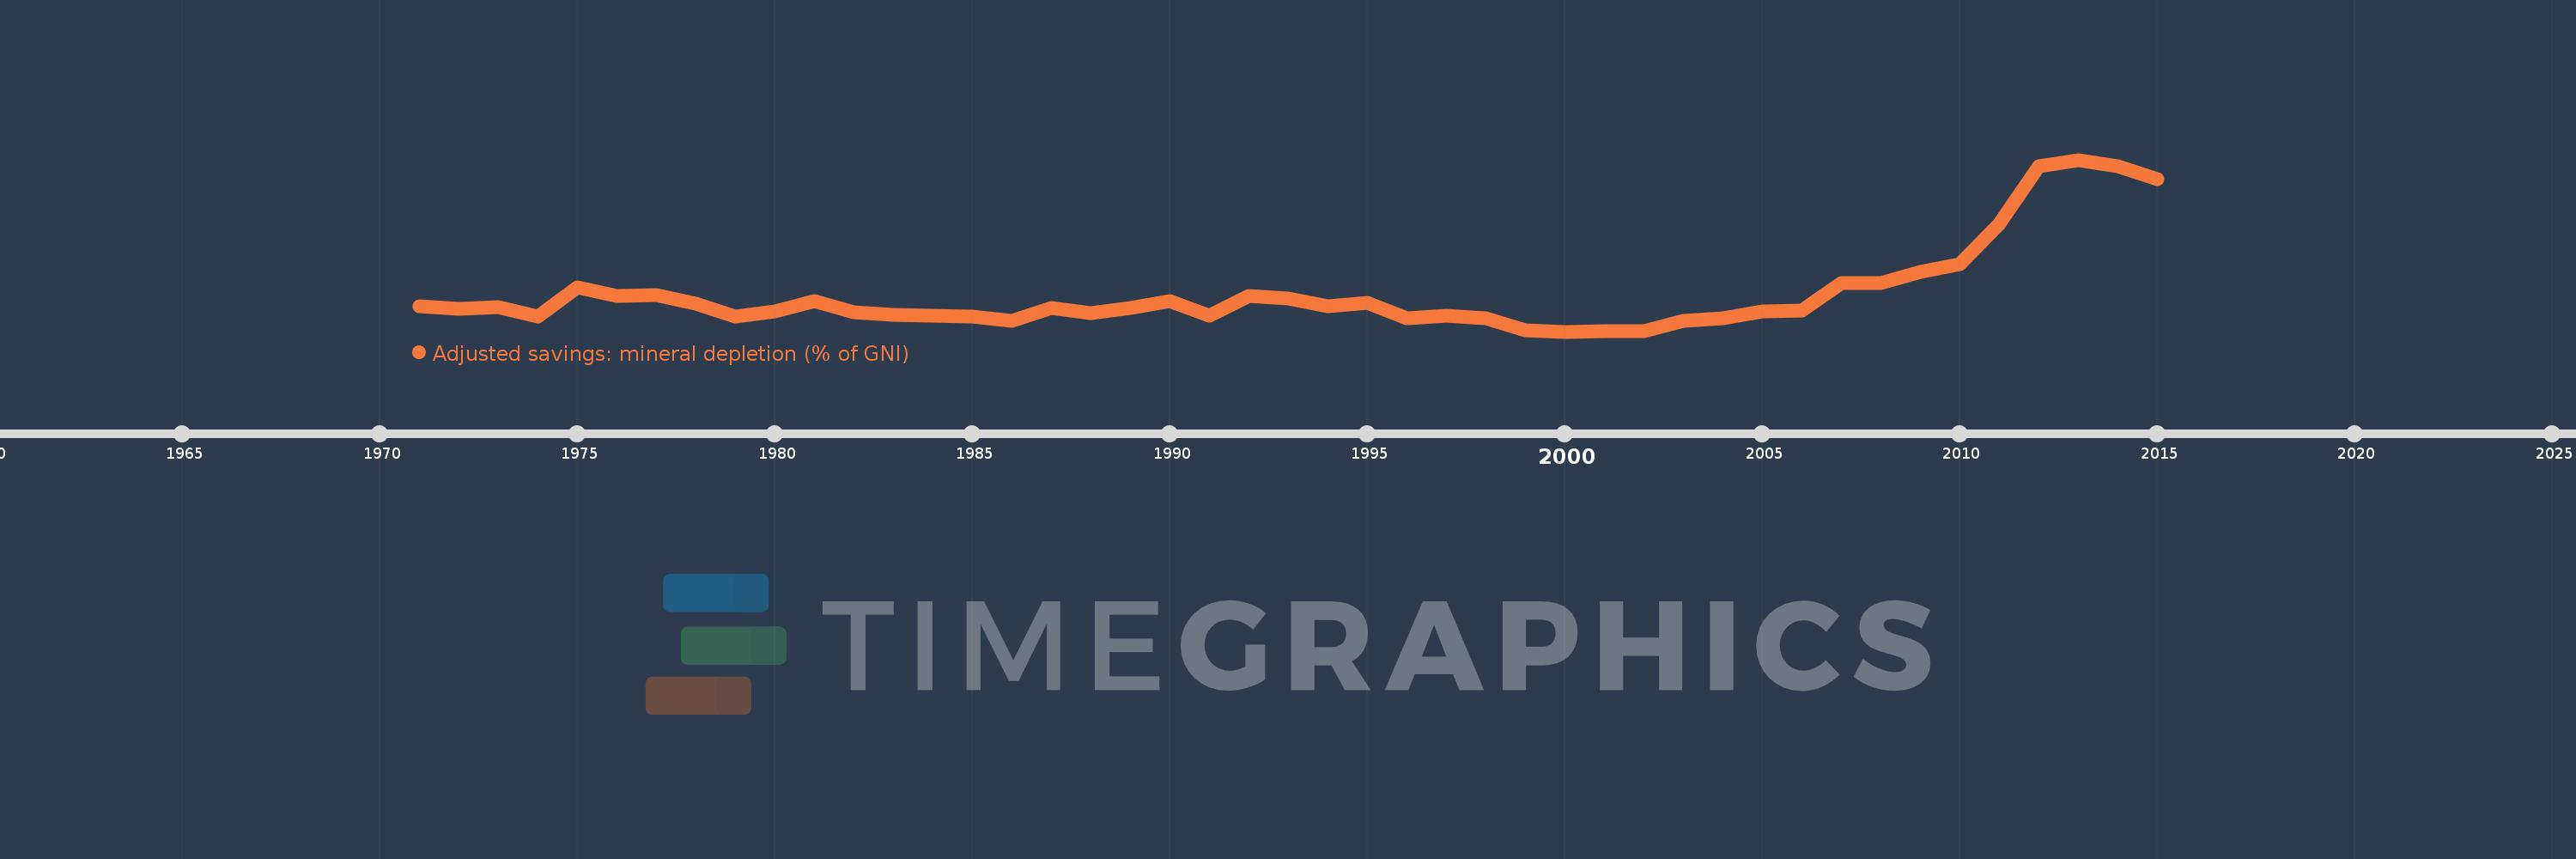
Adjusted savings: mineral depletion (% of GNI)
2015,2014,2013,2012,2011,2010,2009,2008,2007,2006,2005,2004,2003,2002,2001,2000,1999,1998,1997,1996,1995,1994,1993,1992,1991,1990,1989,1988,1987,1986,1985,1984,1983,1982,1981,1980,1979,1978,1977,1976,1975,1974,1973,1972,1971
This statistics in other country:
AfghanistanAlbaniaAlgeriaAmerican SamoaAndorraAngolaAntigua and BarbudaArab WorldArgentinaArmeniaAustraliaAustriaAzerbaijanBahamas, TheBahrainBangladeshBarbadosBelarusBelgiumBelizeBeninBermudaBhutanBoliviaBosnia and HerzegovinaBotswanaBrazilBrunei DarussalamBulgariaBurkina FasoBurundiCabo VerdeCambodiaCameroonCanadaCaribbean small statesCentral African RepublicCentral Europe and the BalticsChadChannel IslandsChileChinaColombiaComorosCongo, Dem. Rep.Congo, Rep.Costa RicaCote d'IvoireCroatiaCubaCyprusCzech RepublicDenmarkDjiboutiDominicaDominican RepublicEarly-demographic dividendEast Asia & PacificEast Asia & Pacific (excluding high income)East Asia & Pacific (IDA & IBRD countries)EcuadorEgypt, Arab Rep.El SalvadorEquatorial GuineaEritreaEstoniaEthiopiaEuro areaEurope & Central AsiaEurope & Central Asia (excluding high income)Europe & Central Asia (IDA & IBRD countries)European UnionFaroe IslandsFijiFinlandFragile and conflict affected situationsFranceFrench PolynesiaGabonGambia, TheGeorgiaGermanyGhanaGreeceGreenlandGrenadaGuatemalaGuineaGuinea-BissauGuyanaHaitiHeavily indebted poor countries (HIPC)High incomeHondurasHong Kong SAR, ChinaHungaryIBRD onlyIcelandIDA & IBRD totalIDA blendIDA onlyIDA totalIndiaIndonesiaIran, Islamic Rep.IraqIrelandIsle of ManIsraelItalyJamaicaJapanJordanKazakhstanKenyaKiribatiKorea, Rep.KosovoKuwaitKyrgyz RepublicLao PDRLate-demographic dividendLatin America & Caribbean Latin America & Caribbean (excluding high income)Latin America & the Caribbean (IDA & IBRD countries)LatviaLeast developed countries: UN classificationLebanonLesothoLiberiaLibyaLiechtensteinLithuaniaLow & middle incomeLow incomeLower middle incomeLuxembourgMacao SAR, ChinaMacedonia, FYRMadagascarMalawiMalaysiaMaldivesMaliMaltaMarshall IslandsMauritaniaMauritiusMexicoMicronesia, Fed. Sts.Middle East & North AfricaMiddle East & North Africa (excluding high income)Middle East & North Africa (IDA & IBRD countries)Middle incomeMoldovaMonacoMongoliaMontenegroMoroccoMozambiqueMyanmarNamibiaNepalNetherlandsNew CaledoniaNew ZealandNicaraguaNigerNigeriaNorth AmericaNorwayOECD membersOmanOther small statesPacific island small statesPakistanPalauPanamaPapua New GuineaParaguayPeruPhilippinesPolandPortugalPost-demographic dividendPre-demographic dividendPuerto RicoQatarRomaniaRussian FederationRwandaSamoaSan MarinoSao Tome and PrincipeSaudi ArabiaSenegalSerbiaSeychellesSierra LeoneSingaporeSlovak RepublicSloveniaSmall statesSolomon IslandsSomaliaSouth AfricaSouth AsiaSouth Asia (IDA & IBRD)South SudanSpainSri LankaSt. Kitts and NevisSt. LuciaSt. Vincent and the GrenadinesSub-Saharan Africa Sub-Saharan Africa (excluding high income)Sub-Saharan Africa (IDA & IBRD countries)SudanSurinameSwazilandSwedenSwitzerlandSyrian Arab RepublicTajikistanTanzaniaThailandTimor-LesteTogoTongaTrinidad and TobagoTunisiaTurkeyTurkmenistanTuvaluUgandaUkraineUnited Arab EmiratesUnited KingdomUnited StatesUpper middle incomeUruguayUzbekistanVanuatuVenezuela, RBVietnamVirgin Islands (U.S.)West Bank and GazaWorldYemen, Rep.ZambiaZimbabwe Timeline:
This timeline shows a graph from 1971 to 2015 of Low income. No data until 1970. Number of actual observations by date: 45.
Source name:
World Development Indicators
Source organization:
World Bank staff estimates based on sources and methods in World Bank's "The Changing Wealth of Nations: Measuring Sustainable Development in the New Millennium" (2011).
Categories, topics:
Economy & Growth, Energy & Mining, Environment
Last updated:
apr 23, 2017
Indicators value changes by year
At the date of observation
Value
Absolute change
Change from previous value
jan 1, 1971
0.503
+0.503
0.0%
jan 1, 1972
0.464
-0.04
-7.86%
jan 1, 1973
0.489
+0.025
5.36%
jan 1, 1974
0.343
-0.146
-29.79%
jan 1, 1975
0.791
+0.448
130.47%
jan 1, 1976
0.653
-0.137
-17.36%
jan 1, 1977
0.666
+0.012
1.88%
jan 1, 1978
0.546
-0.119
-17.91%
jan 1, 1979
0.345
-0.201
-36.84%
jan 1, 1980
0.427
+0.082
23.64%
jan 1, 1981
0.576
+0.149
34.87%
jan 1, 1982
0.41
-0.165
-28.75%
jan 1, 1983
0.37
-0.04
-9.75%
jan 1, 1984
0.352
-0.018
-4.8%
jan 1, 1985
0.338
-0.014
-3.94%
jan 1, 1986
0.276
-0.062
-18.36%
jan 1, 1987
0.469
+0.193
69.78%
jan 1, 1988
0.398
-0.071
-15.08%
jan 1, 1989
0.47
+0.071
17.89%
jan 1, 1990
0.573
+0.104
22.13%
jan 1, 1991
0.364
-0.209
-36.47%
jan 1, 1992
0.656
+0.292
80.14%
jan 1, 1993
0.618
-0.039
-5.89%
jan 1, 1994
0.495
-0.123
-19.9%
jan 1, 1995
0.548
+0.054
10.85%
jan 1, 1996
0.323
-0.225
-41.02%
jan 1, 1997
0.353
+0.03
9.14%
jan 1, 1998
0.316
-0.037
-10.35%
jan 1, 1999
0.132
-0.185
-58.43%
jan 1, 2000
0.116
-0.015
-11.59%
jan 1, 2001
0.124
+0.008
6.51%
jan 1, 2002
0.126
+0.002
1.76%
jan 1, 2003
0.275
+0.149
118.41%
jan 1, 2004
0.32
+0.045
16.36%
jan 1, 2005
0.429
+0.109
34.03%
jan 1, 2006
0.43
+0.001
0.21%
jan 1, 2007
0.857
+0.426
99.13%
jan 1, 2008
0.854
-0.003
-0.34%
jan 1, 2009
1.019
+0.165
19.33%
jan 1, 2010
1.147
+0.128
12.61%
jan 1, 2011
1.757
+0.609
53.12%
jan 1, 2012
2.623
+0.866
49.3%
jan 1, 2013
2.727
+0.104
3.97%
jan 1, 2014
2.631
-0.096
-3.51%
jan 1, 2015
2.431
-0.2
-7.59%
Ranking of countries by current statistics by years


Comments: