29
/
en
AIzaSyAYiBZKx7MnpbEhh9jyipgxe19OcubqV5w
April 1, 2024
100806
Canada
CAN
true
2
1
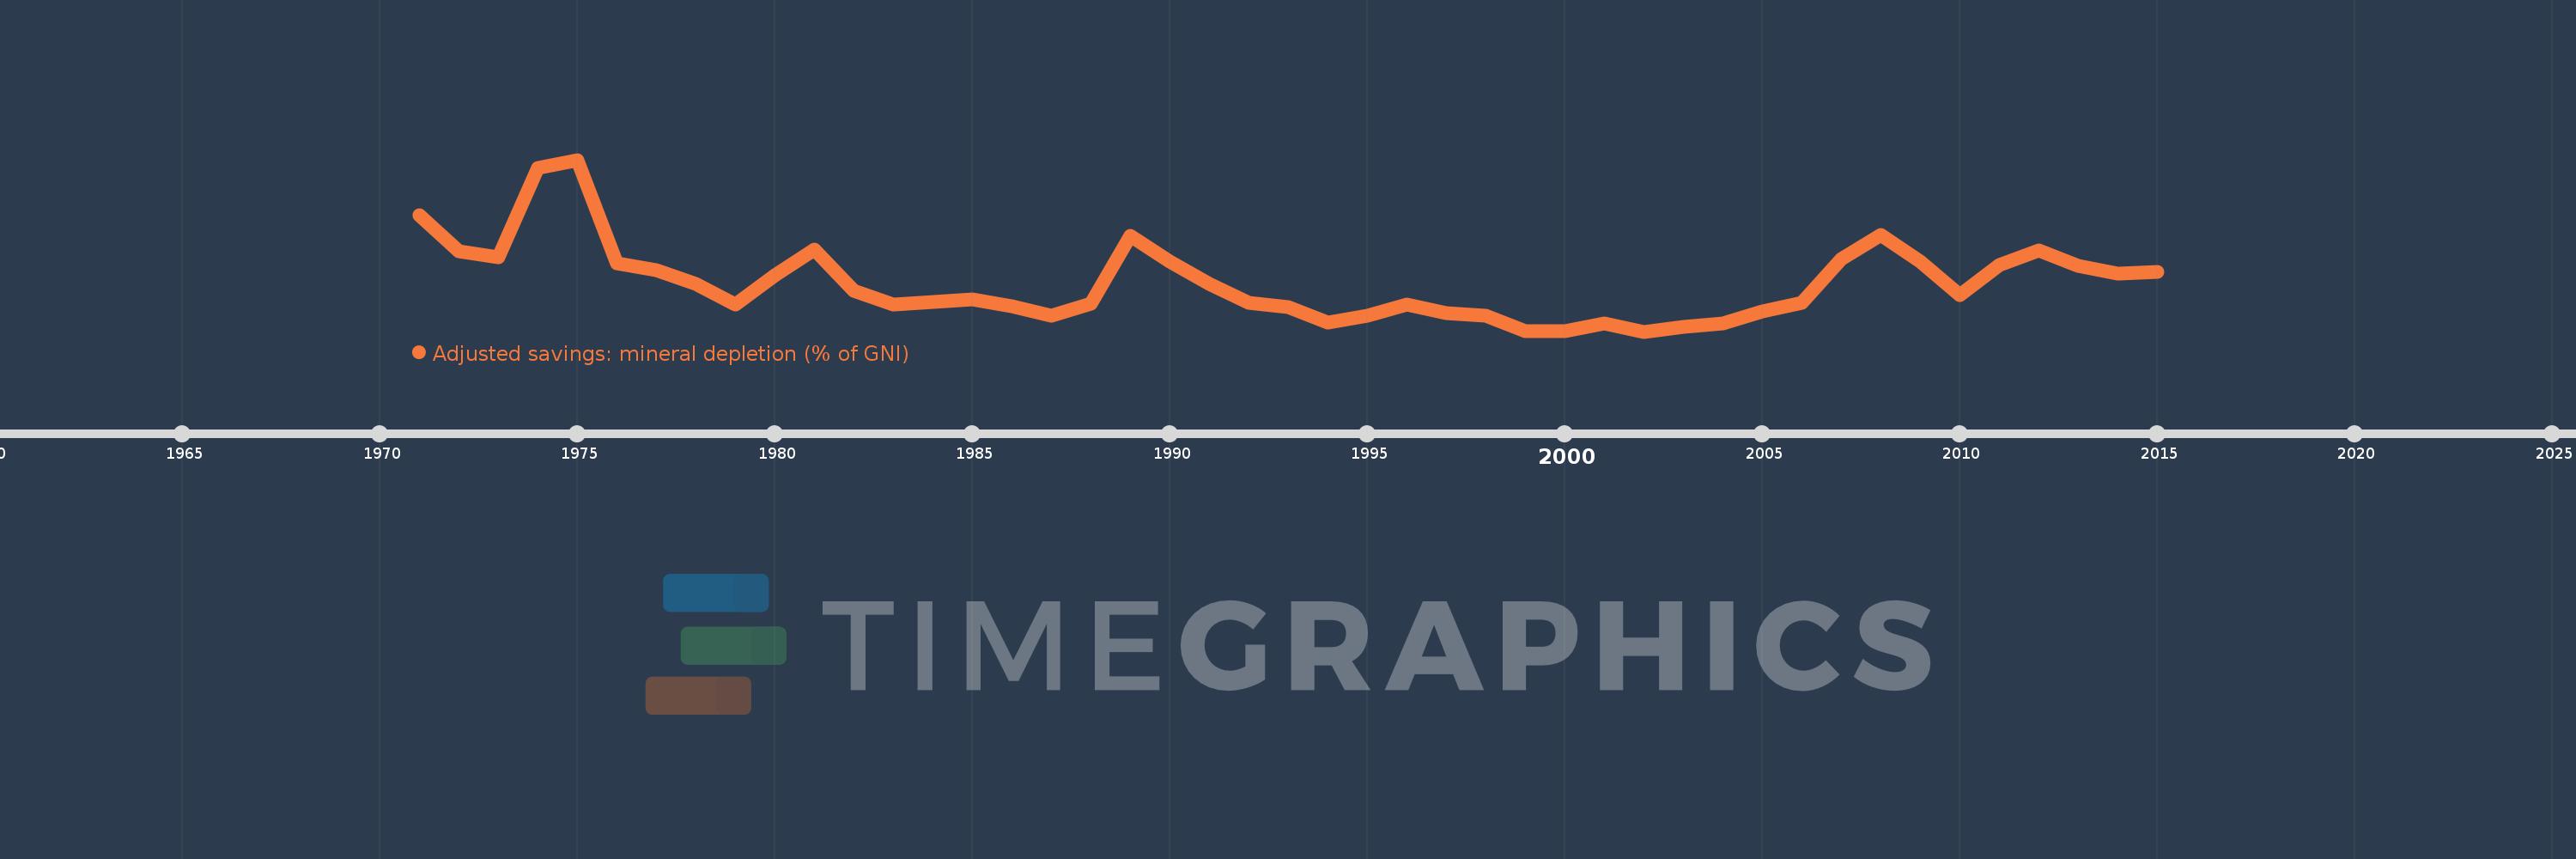
Adjusted savings: mineral depletion (% of GNI)
2015,2014,2013,2012,2011,2010,2009,2008,2007,2006,2005,2004,2003,2002,2001,2000,1999,1998,1997,1996,1995,1994,1993,1992,1991,1990,1989,1988,1987,1986,1985,1984,1983,1982,1981,1980,1979,1978,1977,1976,1975,1974,1973,1972,1971
This statistics in other country:
AfghanistanAlbaniaAlgeriaAmerican SamoaAndorraAngolaAntigua and BarbudaArab WorldArgentinaArmeniaAustraliaAustriaAzerbaijanBahamas, TheBahrainBangladeshBarbadosBelarusBelgiumBelizeBeninBermudaBhutanBoliviaBosnia and HerzegovinaBotswanaBrazilBrunei DarussalamBulgariaBurkina FasoBurundiCabo VerdeCambodiaCameroonCanadaCaribbean small statesCentral African RepublicCentral Europe and the BalticsChadChannel IslandsChileChinaColombiaComorosCongo, Dem. Rep.Congo, Rep.Costa RicaCote d'IvoireCroatiaCubaCyprusCzech RepublicDenmarkDjiboutiDominicaDominican RepublicEarly-demographic dividendEast Asia & PacificEast Asia & Pacific (excluding high income)East Asia & Pacific (IDA & IBRD countries)EcuadorEgypt, Arab Rep.El SalvadorEquatorial GuineaEritreaEstoniaEthiopiaEuro areaEurope & Central AsiaEurope & Central Asia (excluding high income)Europe & Central Asia (IDA & IBRD countries)European UnionFaroe IslandsFijiFinlandFragile and conflict affected situationsFranceFrench PolynesiaGabonGambia, TheGeorgiaGermanyGhanaGreeceGreenlandGrenadaGuatemalaGuineaGuinea-BissauGuyanaHaitiHeavily indebted poor countries (HIPC)High incomeHondurasHong Kong SAR, ChinaHungaryIBRD onlyIcelandIDA & IBRD totalIDA blendIDA onlyIDA totalIndiaIndonesiaIran, Islamic Rep.IraqIrelandIsle of ManIsraelItalyJamaicaJapanJordanKazakhstanKenyaKiribatiKorea, Rep.KosovoKuwaitKyrgyz RepublicLao PDRLate-demographic dividendLatin America & Caribbean Latin America & Caribbean (excluding high income)Latin America & the Caribbean (IDA & IBRD countries)LatviaLeast developed countries: UN classificationLebanonLesothoLiberiaLibyaLiechtensteinLithuaniaLow & middle incomeLow incomeLower middle incomeLuxembourgMacao SAR, ChinaMacedonia, FYRMadagascarMalawiMalaysiaMaldivesMaliMaltaMarshall IslandsMauritaniaMauritiusMexicoMicronesia, Fed. Sts.Middle East & North AfricaMiddle East & North Africa (excluding high income)Middle East & North Africa (IDA & IBRD countries)Middle incomeMoldovaMonacoMongoliaMontenegroMoroccoMozambiqueMyanmarNamibiaNepalNetherlandsNew CaledoniaNew ZealandNicaraguaNigerNigeriaNorth AmericaNorwayOECD membersOmanOther small statesPacific island small statesPakistanPalauPanamaPapua New GuineaParaguayPeruPhilippinesPolandPortugalPost-demographic dividendPre-demographic dividendPuerto RicoQatarRomaniaRussian FederationRwandaSamoaSan MarinoSao Tome and PrincipeSaudi ArabiaSenegalSerbiaSeychellesSierra LeoneSingaporeSlovak RepublicSloveniaSmall statesSolomon IslandsSomaliaSouth AfricaSouth AsiaSouth Asia (IDA & IBRD)South SudanSpainSri LankaSt. Kitts and NevisSt. LuciaSt. Vincent and the GrenadinesSub-Saharan Africa Sub-Saharan Africa (excluding high income)Sub-Saharan Africa (IDA & IBRD countries)SudanSurinameSwazilandSwedenSwitzerlandSyrian Arab RepublicTajikistanTanzaniaThailandTimor-LesteTogoTongaTrinidad and TobagoTunisiaTurkeyTurkmenistanTuvaluUgandaUkraineUnited Arab EmiratesUnited KingdomUnited StatesUpper middle incomeUruguayUzbekistanVanuatuVenezuela, RBVietnamVirgin Islands (U.S.)West Bank and GazaWorldYemen, Rep.ZambiaZimbabwe Timeline:
This timeline shows a graph from 1971 to 2015 of Canada. No data until 1970. Number of actual observations by date: 45.
Source name:
World Development Indicators
Source organization:
World Bank staff estimates based on sources and methods in World Bank's "The Changing Wealth of Nations: Measuring Sustainable Development in the New Millennium" (2011).
Categories, topics:
Economy & Growth, Energy & Mining, Environment
Last updated:
apr 23, 2017
Indicators value changes by year
At the date of observation
Value
Absolute change
Change from previous value
jan 1, 1971
0.952
+0.952
0.0%
jan 1, 1972
0.683
-0.269
-28.24%
jan 1, 1973
0.633
-0.05
-7.3%
jan 1, 1974
1.313
+0.679
107.27%
jan 1, 1975
1.374
+0.061
4.63%
jan 1, 1976
0.587
-0.786
-57.23%
jan 1, 1977
0.54
-0.048
-8.1%
jan 1, 1978
0.432
-0.108
-19.99%
jan 1, 1979
0.274
-0.158
-36.65%
jan 1, 1980
0.499
+0.225
82.22%
jan 1, 1981
0.695
+0.197
39.43%
jan 1, 1982
0.381
-0.314
-45.15%
jan 1, 1983
0.275
-0.106
-27.8%
jan 1, 1984
0.295
+0.02
7.14%
jan 1, 1985
0.313
+0.018
6.15%
jan 1, 1986
0.261
-0.052
-16.51%
jan 1, 1987
0.189
-0.072
-27.73%
jan 1, 1988
0.284
+0.095
50.21%
jan 1, 1989
0.799
+0.515
181.63%
jan 1, 1990
0.602
-0.198
-24.73%
jan 1, 1991
0.432
-0.17
-28.26%
jan 1, 1992
0.29
-0.141
-32.71%
jan 1, 1993
0.255
-0.036
-12.23%
jan 1, 1994
0.142
-0.113
-44.37%
jan 1, 1995
0.194
+0.052
37.02%
jan 1, 1996
0.276
+0.081
41.92%
jan 1, 1997
0.208
-0.067
-24.46%
jan 1, 1998
0.192
-0.017
-8.02%
jan 1, 1999
0.076
-0.115
-60.27%
jan 1, 2000
0.072
-0.004
-4.85%
jan 1, 2001
0.133
+0.061
84.01%
jan 1, 2002
0.071
-0.063
-46.98%
jan 1, 2003
0.106
+0.036
50.62%
jan 1, 2004
0.136
+0.03
27.77%
jan 1, 2005
0.227
+0.091
66.67%
jan 1, 2006
0.291
+0.064
28.23%
jan 1, 2007
0.621
+0.331
113.74%
jan 1, 2008
0.802
+0.181
29.15%
jan 1, 2009
0.6
-0.202
-25.19%
jan 1, 2010
0.348
-0.253
-42.08%
jan 1, 2011
0.576
+0.228
65.68%
jan 1, 2012
0.684
+0.108
18.73%
jan 1, 2013
0.569
-0.115
-16.81%
jan 1, 2014
0.509
-0.06
-10.53%
jan 1, 2015
0.522
+0.013
2.61%
Ranking of countries by current statistics by years


Comments: