30
/
AIzaSyAYiBZKx7MnpbEhh9jyipgxe19OcubqV5w
April 1, 2024
158163
Iraq
IRQ
true
2
1
Adjusted savings: mineral depletion (% of GNI)
2015,2014,2013,2012,2011,2010,2009,2008,2007,2006,2005,1991,1990,1989,1988,1987,1986,1985,1984,1983,1982,1981
Download
Global statistics library →Iraq →

Adjusted savings: mineral depletion (% of GNI)

This statistics in other country:

AfghanistanAlbaniaAlgeriaAmerican SamoaAndorraAngolaAntigua and BarbudaArab WorldArgentinaArmeniaAustraliaAustriaAzerbaijanBahamas, TheBahrainBangladeshBarbadosBelarusBelgiumBelizeBeninBermudaBhutanBoliviaBosnia and HerzegovinaBotswanaBrazilBrunei DarussalamBulgariaBurkina FasoBurundiCabo VerdeCambodiaCameroonCanadaCaribbean small statesCentral African RepublicCentral Europe and the BalticsChadChannel IslandsChileChinaColombiaComorosCongo, Dem. Rep.Congo, Rep.Costa RicaCote d'IvoireCroatiaCubaCyprusCzech RepublicDenmarkDjiboutiDominicaDominican RepublicEarly-demographic dividendEast Asia & PacificEast Asia & Pacific (excluding high income)East Asia & Pacific (IDA & IBRD countries)EcuadorEgypt, Arab Rep.El SalvadorEquatorial GuineaEritreaEstoniaEthiopiaEuro areaEurope & Central AsiaEurope & Central Asia (excluding high income)Europe & Central Asia (IDA & IBRD countries)European UnionFaroe IslandsFijiFinlandFragile and conflict affected situationsFranceFrench PolynesiaGabonGambia, TheGeorgiaGermanyGhanaGreeceGreenlandGrenadaGuatemalaGuineaGuinea-BissauGuyanaHaitiHeavily indebted poor countries (HIPC)High incomeHondurasHong Kong SAR, ChinaHungaryIBRD onlyIcelandIDA & IBRD totalIDA blendIDA onlyIDA totalIndiaIndonesiaIran, Islamic Rep.IraqIrelandIsle of ManIsraelItalyJamaicaJapanJordanKazakhstanKenyaKiribatiKorea, Rep.KosovoKuwaitKyrgyz RepublicLao PDRLate-demographic dividendLatin America & Caribbean Latin America & Caribbean (excluding high income)Latin America & the Caribbean (IDA & IBRD countries)LatviaLeast developed countries: UN classificationLebanonLesothoLiberiaLibyaLiechtensteinLithuaniaLow & middle incomeLow incomeLower middle incomeLuxembourgMacao SAR, ChinaMacedonia, FYRMadagascarMalawiMalaysiaMaldivesMaliMaltaMarshall IslandsMauritaniaMauritiusMexicoMicronesia, Fed. Sts.Middle East & North AfricaMiddle East & North Africa (excluding high income)Middle East & North Africa (IDA & IBRD countries)Middle incomeMoldovaMonacoMongoliaMontenegroMoroccoMozambiqueMyanmarNamibiaNepalNetherlandsNew CaledoniaNew ZealandNicaraguaNigerNigeriaNorth AmericaNorwayOECD membersOmanOther small statesPacific island small statesPakistanPalauPanamaPapua New GuineaParaguayPeruPhilippinesPolandPortugalPost-demographic dividendPre-demographic dividendPuerto RicoQatarRomaniaRussian FederationRwandaSamoaSan MarinoSao Tome and PrincipeSaudi ArabiaSenegalSerbiaSeychellesSierra LeoneSingaporeSlovak RepublicSloveniaSmall statesSolomon IslandsSomaliaSouth AfricaSouth AsiaSouth Asia (IDA & IBRD)South SudanSpainSri LankaSt. Kitts and NevisSt. LuciaSt. Vincent and the GrenadinesSub-Saharan Africa Sub-Saharan Africa (excluding high income)Sub-Saharan Africa (IDA & IBRD countries)SudanSurinameSwazilandSwedenSwitzerlandSyrian Arab RepublicTajikistanTanzaniaThailandTimor-LesteTogoTongaTrinidad and TobagoTunisiaTurkeyTurkmenistanTuvaluUgandaUkraineUnited Arab EmiratesUnited KingdomUnited StatesUpper middle incomeUruguayUzbekistanVanuatuVenezuela, RBVietnamVirgin Islands (U.S.)West Bank and GazaWorldYemen, Rep.ZambiaZimbabwe

Timeline:

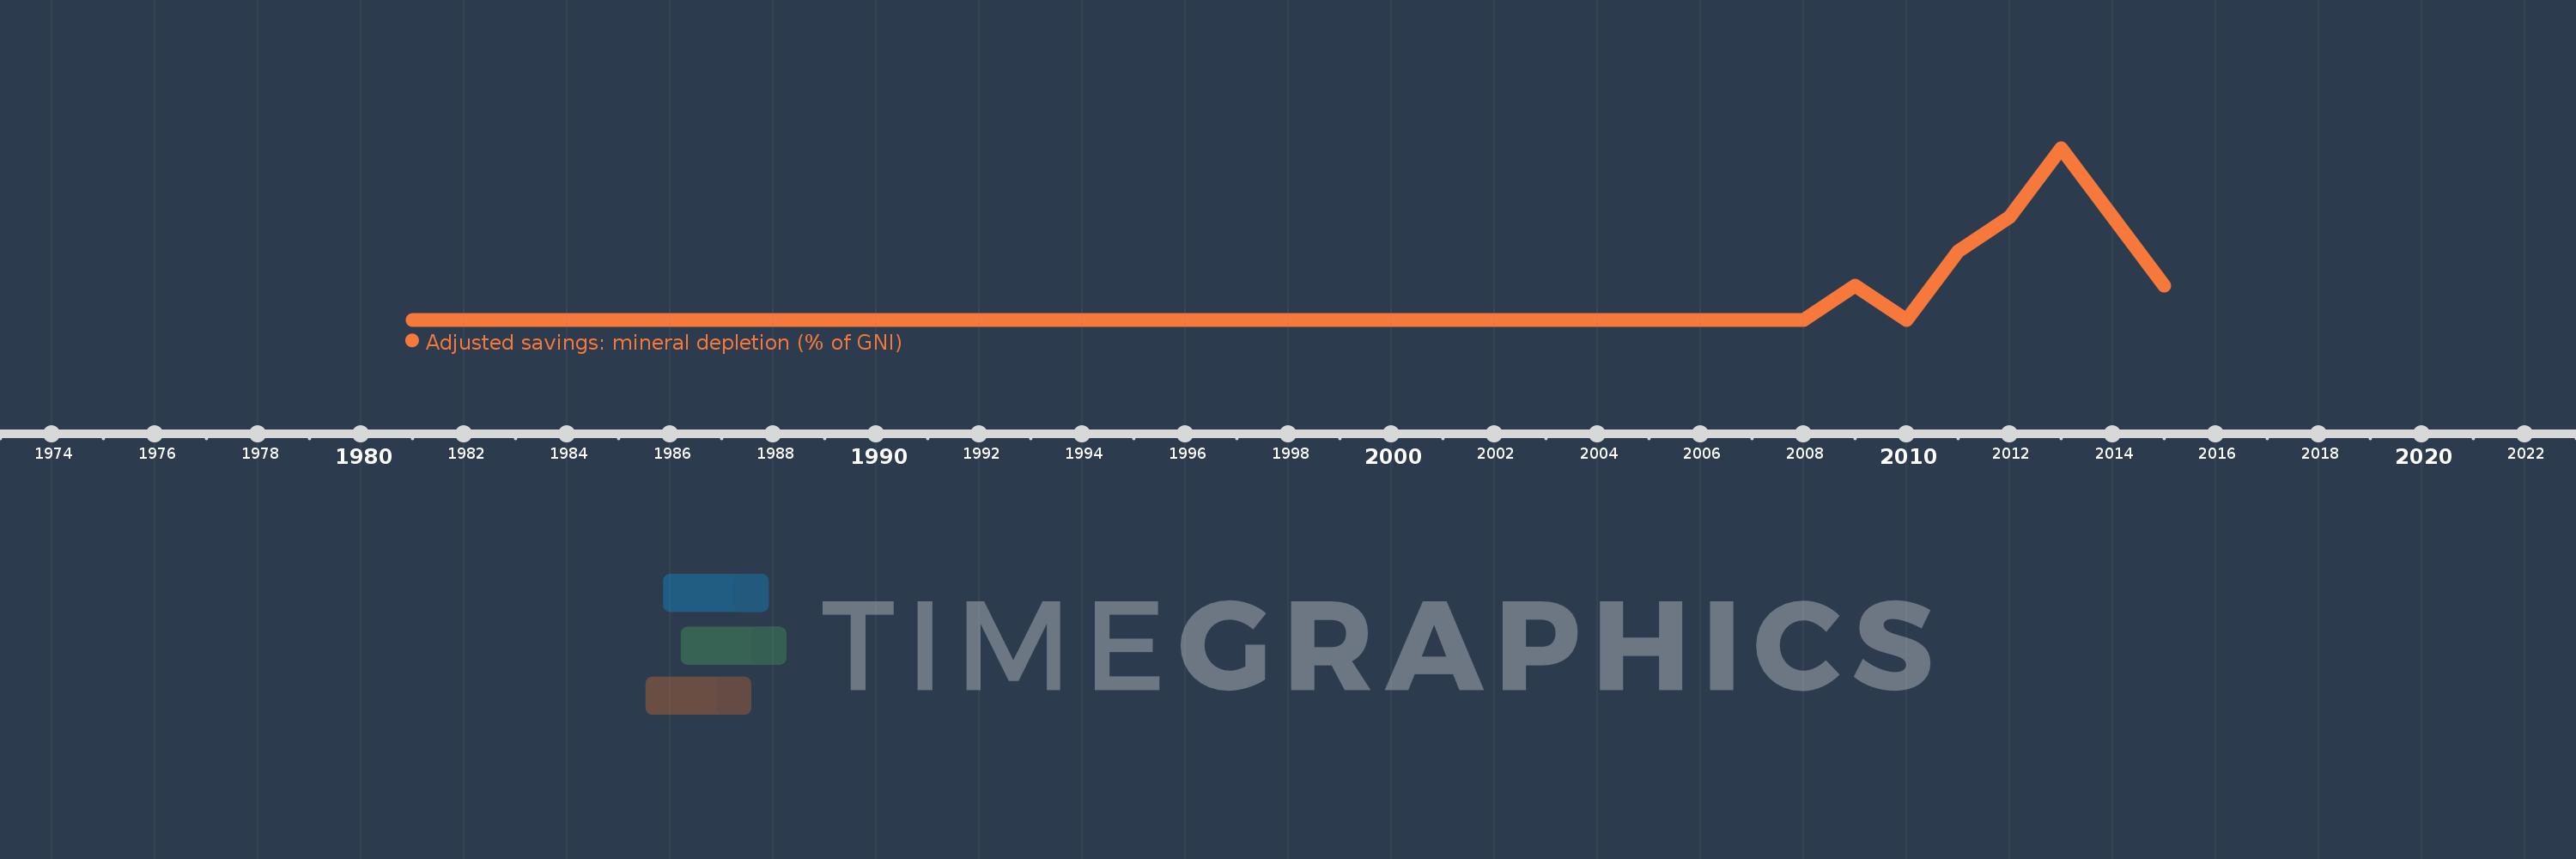
This timeline shows a graph from 1981 to 2015 of Iraq. No data until 1980. Number of actual observations by date: 22.

Source name:

World Development Indicators

Source organization:

World Bank staff estimates based on sources and methods in World Bank's "The Changing Wealth of Nations: Measuring Sustainable Development in the New Millennium" (2011).

Categories, topics:

Economy & Growth, Energy & Mining, Environment

Last updated:

apr 23, 2017

Indicators value changes by year

Meaning:
0.001
Minimum:
0.0
jan 1, 1981
Maximum:
0.005
jan 1, 2013
At the date of observation
Value
Absolute change
Change from the previous value
jan 1, 1981
0.0
0.0
0.0%
jan 1, 1982
0.0
0.0
%
jan 1, 1983
0.0
0.0
%
jan 1, 1984
0.0
0.0
%
jan 1, 1985
0.0
0.0
%
jan 1, 1986
0.0
0.0
%
jan 1, 1987
0.0
0.0
%
jan 1, 1988
0.0
0.0
%
jan 1, 1989
0.0
0.0
%
jan 1, 1990
0.0
0.0
%
jan 1, 1991
0.0
0.0
%
jan 1, 2005
0.0
0.0
%
jan 1, 2006
0.0
0.0
%
jan 1, 2007
0.0
0.0
%
jan 1, 2008
0.0
0.0
%
jan 1, 2009
0.001
+0.001
%
jan 1, 2010
0.0
0.0
-47.5%
jan 1, 2011
0.002
+0.001
261.56%
jan 1, 2012
0.003
+0.001
67.91%
jan 1, 2013
0.005
+0.002
77.82%
jan 1, 2014
0.003
-0.002
-43.45%
jan 1, 2015
0.001
-0.002
-67.35%

Ranking of countries by current statistics by years